On Oct. 31, 1994, an ATR 72, American Eagle Flight 4184, departed from Indianapolis for Chicago O’Hare International Airport with 64 passengers and four crewmembers. Due to traffic at O’Hare, the aircraft was held over Roselawn, Indiana, at 10,000 ft in icing conditions. The ice protection system (IPS) was functioning, and the wing flaps were partially extended. Air traffic control cleared the aircraft to 8,000 ft, and while descending, the flap overspeed warning sounded. The copilot raised the wing flaps, and the angle of attack began increasing. Suddenly, the right wing stalled, the autopilot disconnected, and the control column deflected full right. The aircraft rolled uncontrollably into a steep right bank and entered a dive. As the angle of attack decreased in the dive, aileron control was regained, but both pilots began pulling back on the control column to recover from the dive. Angle of attack increased, the right wing stalled a second time, and the control column again deflected full right. The aircraft entered a steep rolling dive from which recovery was impossible and crashed. All passengers and crew were killed.
The subsequent accident investigation determined that the probable cause was “the accretion of a ridge of ice aft of the de-icing boots, upstream of the ailerons, due to a prolonged operation of Flight 4184 in a freezing drizzle environment, well beyond the aircraft’s certification envelope.”1 Contributing factors included errors by the flight crew, “insufficient recognition by airworthiness authorities and the aviation industry worldwide of freezing drizzle characteristics and their potential effect on aircraft performance and controllability,” and the failure of civil aviation authorities to provide regulation for flight in icing conditions, other than the U.S. Federal Aviation Regulations (FARs) Part 25, Appendix C icing envelopes.
The Appendix C icing certification envelopes, which were developed in the 1940s by the U.S. National Advisory Committee for Aeronautics (the precursor to the National Aeronautics and Space Administration [NASA]),2 characterize supercooled icing “cloud water droplets” in terms of their size and distribution in a cloud. After 1973, all airplanes certified for icing had to show safe operation in these conditions (NASA video, above). Cloud water droplets are extremely small — about the size of a grain of flour.3 But in nature, icing conditions also exist that produce much larger droplets. These are supercooled large droplets (SLD), which exist in two sub-categories: freezing drizzle droplets (FZDZ), with diameters up to 0.5mm (0.02 in), and freezing rain droplets (FZRA), which can be five times larger, or even bigger. SLD can result in ice accretions that cannot be removed by an IPS designed for Appendix C conditions due to the larger droplet inertia causing impacts aft of the IPS. Figure 1 shows an approximate graphic relationship between Appendix C cloud size water droplets and SLD droplets.4
Figure 1 — Graphic Illustration of Relative Sizes of Cloud and SLD Water Droplet Diameters
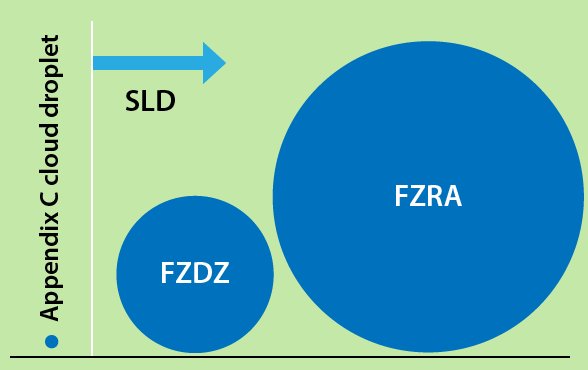
FZDZ = freezing drizzle; FZRA = freezing rain; SLD = supercooled large droplet
Source: Ben C. Bernstein, Meteorologist, Leading Edge Atmospherics
Contrasting Ice Formations
Appendix C icing clouds can develop if two primary conditions exist — the presence of liquid water droplets and a subfreezing temperature. When an aircraft flies through a cloud containing these supercooled water droplets, ice can form. Photo A illustrates an Appendix C ice formation on an unprotected wing’s leading edge. The black area is the area an IPS will protect in these conditions.
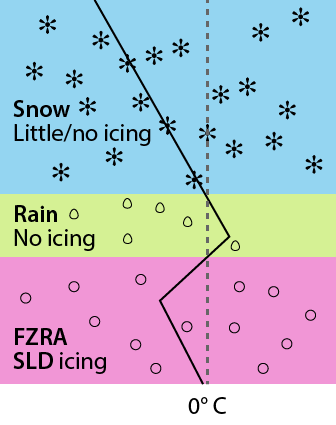
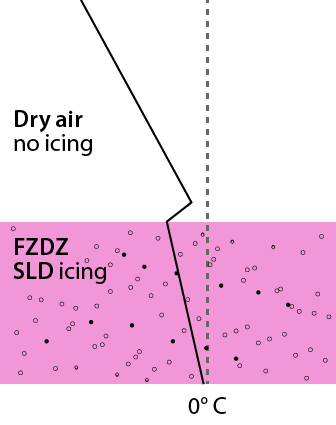
FZDZ and FZRA are generally formed by different mechanisms.5 FZRA forms in what is termed a “classical” manner, and occurs when snow falls through a layer of warm (above freezing) air, turning the snow into rain. The rain continues to fall and then reaches a second sub-freezing layer below, causing the raindrops to become supercooled. If supercooled raindrops freeze when they strike a surface (such as the ground or an aircraft), they are considered to be FZRA. FZDZ, on the other hand, typically forms via the “non-classical” mechanism, when water droplets collide with each other and coalesce into larger supercooled droplets.6 If the droplets become large enough, they can reach the drizzle size range, becoming “supercooled drizzle.” If this drizzle freezes when it strikes a surface, it is FZDZ. If an aircraft flies through either condition, potentially hazardous ice formations result. Figures 2 and 3 illustrate these formation mechanisms; diagonal lines illustrate air temperature vs. altitude.7
Figure 2 — FZRA Classical Formation Process
FZRA = freezing rain; SLD = supercooled large droplet
Source: Ben C. Bernstein, Meteorologist, Leading Edge Atmospherics
In Figure 2, FZRA is indicated as occurring at the surface. It is possible for rain to be indicated at the surface if the temperature beneath the lower sub-freezing layer rises above freezing. Ice pellets can be reported if the melting in the warm layer aloft is incomplete and the partially melted raindrops refreeze at the lower sub-freezing level. FZRA can also be mixed with ice pellets, snow and/or rain, depending on the details of the vertical structure, the intensity of the precipitation and the size of the snowflakes falling from the upper layer. It is important to note that a subfreezing lower layer must be present if FZRA is to exist. Radars typically see this condition well, since the droplets are large. The condition described in Figure 2 is most often found ahead of advancing warm fronts.
Figure 3 — FZDZ Non-Classical Formation Process
FZDZ = freezing drizzle; SLD = supercooled large droplet
Source: Ben C. Bernstein, Meteorologist, Leading Edge Atmospherics
In Figure 3, FZDZ is indicated as occurring at the surface, and the lower cloud layer (pink) consists of supercooled water droplets that are colliding, coalescing and falling toward the surface. Some drops may evaporate before reaching the ground. They also can warm to temperatures above zero, resulting in reports of drizzle at the ground. Because the drops are relatively small, radar returns tend to be relatively weak, making them difficult or impossible to see on some radar plots. In addition, they often are evident only in close proximity to the radars. Reports of FZDZ at the surface are a strong indicator of the presence of FZDZ aloft; however, many airports cannot report FZDZ due to lack of a trained observer on site and/or limitations in equipment.
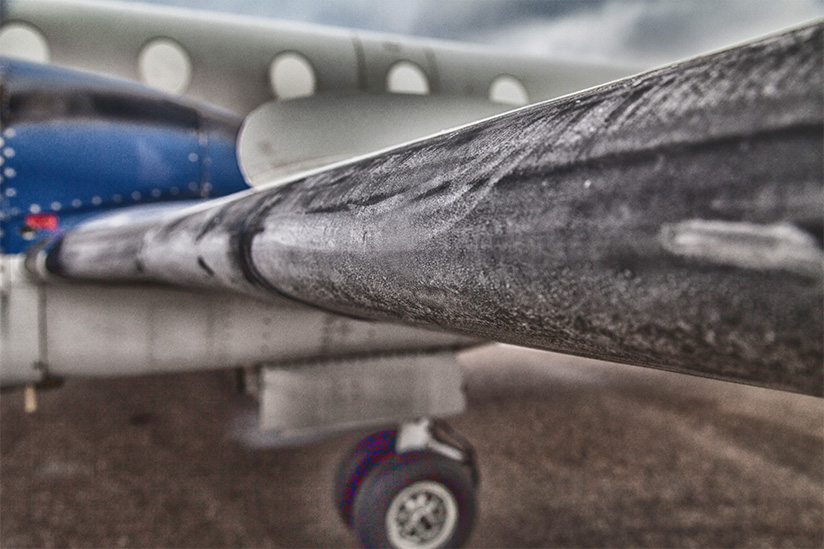
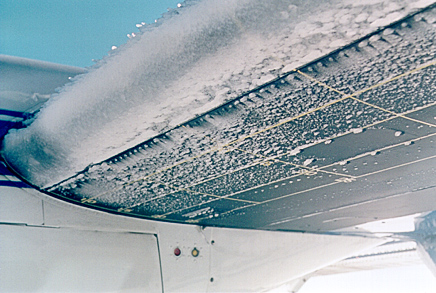
Photo B illustrates an FZDZ accumulation on an unprotected wing. Note that the ice formed well beyond the area that would be protected by wing deicing pneumatic boots.
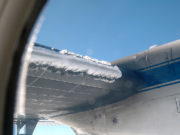
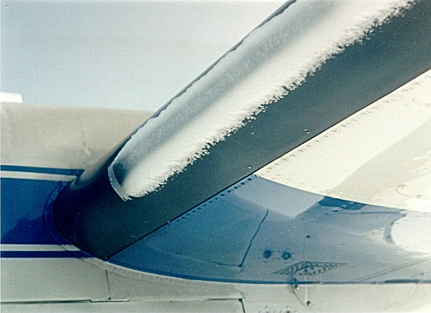
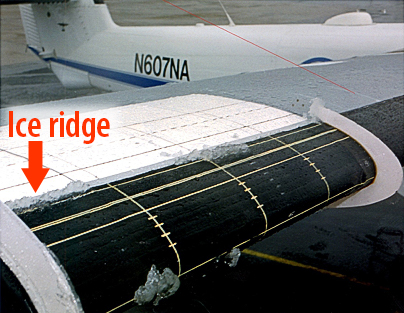
Ice protection systems have generally been designed to handle Appendix C conditions. When such a system is operated in SLD conditions, a ridge of ice sometimes forms behind the protected area, acting as a spoiler, deflecting the airflow, greatly reducing lift and decreasing the angle of attack at which stalls occur. These ridges aft of the wing boot upper surface can cause early airflow separation and uncommanded aileron deflection, as was the case in the ATR 72 accident. Photo C illustrates this condition on a NASA icing research aircraft after a FZRA encounter.
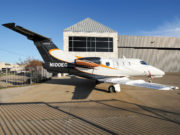
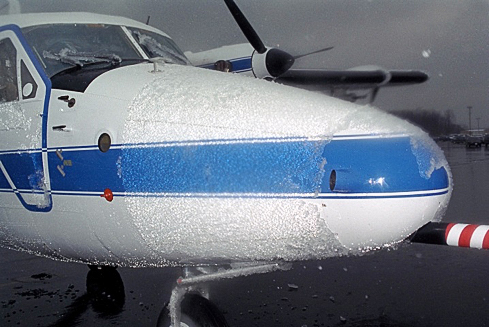
Ice formations from FZRA and FZDZ encounters can also accumulate on large non-lifting surfaces such as a propeller spinner, nose and other areas of the fuselage, greatly increasing drag and reducing aircraft climb and level flight performance. Photo D illustrates a FZRA accumulation on the nose of an aircraft.
Flight Research
In 1995 and 1996, the U.S. Federal Aviation Administration (FAA) sponsored in-flight icing conferences on SLD to determine if changes or modifications to existing aircraft icing certification rules were needed to improve flight safety.8 As a result, the FAA developed a three-year plan for a joint flight research campaign with the NASA Glenn Research Center and the National Center for Atmospheric Research (NCAR). A team of specialists, including pilots, engineers and meteorologists, was assembled to conduct the research program. Three flight campaigns were conducted in the Cleveland area between 1996 and 1998. Later, additional tests were performed jointly with the National Research Council of Canada (NRC). The main objectives were to test and develop weather tools to diagnose and forecast the presence of SLD, to understand the effect of SLD on aircraft performance and to provide valuable comparison data for wind tunnel tests and numerical icing codes used for certification. To that end, NASA employed its de Havilland Canada DH-6 Twin Otter icing research aircraft, which was instrumented to measure and record icing conditions. NCAR provided meteorologists to forecast and direct the aircraft safely into SLD conditions, and the FAA provided program oversight and advocacy and served as the depository for the flight research data. In addition to the NASA/NCAR/FAA project, Environment Canada and the NRC completed similar flight projects with the NRC Convair 580 to collect and characterize the SLD atmospheric environment.9
Meteorological Flight Research
Ninety research flights were conducted by NASA over the three-year period, from which an extensive data base of SLD cloud conditions was made available to both domestic and international agencies for developing forecasting tools, testing standards and SLD instrumentation. Several important observations were made during the conduct of these flights, including:10
- In many cases, SLD encounters occurred in mixed-phase conditions where both cloud liquid water and ice crystals were present at the same time — a finding that also proved true for Appendix C icing clouds.11
- Cloud liquid water content in SLD conditions was less than that found in small droplet Appendix C conditions. This was likely due to the differences in the characteristics of small vs. large droplet concentrations and the fact that large drops tend to precipitate out of the clouds. Additionally, in-cloud visibility during an SLD encounter was usually better than in small droplet icing clouds.
- Small and large supercooled water droplets were commonly found to exist simultaneously within SLD clouds. In the vertical structure of these clouds, smaller droplets tended to dominate the higher portion of the cloud, while large drops tended to dominate the lower portion and were found both between cloud layers and beneath them.
- The climatological data for the past 30 years of observed freezing rain and freezing drizzle at the surface in the Cleveland area correlated well with monthly frequencies of SLD encounters during the flight research program. This is an important indicator of the value placed on these data for developing SLD forecasting tools — and to pilots who are trying to avoid these conditions.
SLD Effects on Performance
NASA’s standard methodology for measuring aircraft performance after an icing encounter (“Discoveries on Ice,” ASW, 2/12) was employed after all meteorological data were collected and ice accretions had formed on the aircraft. Photos E and F show SLD accretions on the right wing of NASA’s icing aircraft after two flights — one in FZDZ and one in FZRA. Significant increases in aircraft drag and loss of lift were measured in each condition.12
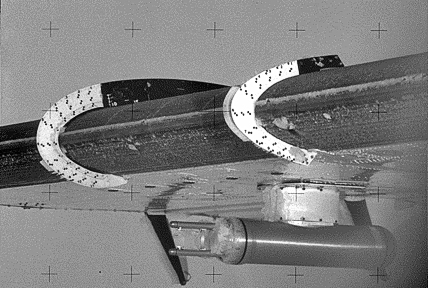
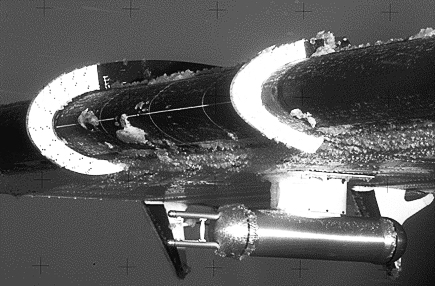
FZDZ resulted in a measured 41 percent reduction in maximum lift coefficient and a 33 percent increase in drag. FZRA resulted in a comparable level of lift loss, but the drag increase was double, largely due to extensive ice formations over much of the aircraft, as shown in Photo D. Notably, the performance losses measured in these two flights were unique to the SLD conditions encountered on those flights — and should not be considered representative of all SLD encounters experienced during the flight research program.13 Regardless, these flights illustrated the potentially hazardous situation that can result from SLD encounters.
Outcomes
Thomas Ratvasky, who was the NASA lead project and flight test engineer for the SLD flight research program, said that the NASA/FAA and Canadian research flights, prompted by the ATR accident, made the aviation community more aware of the threat caused by SLD icing.
“The joint testing performed by NASA and the Environment and Climate Change Canada (formerly Atmospheric Environment Service) and the National Research Council Canada improved SLD cloud characterization, instrumentation and established international standards for data acquisition and analysis,” Ratvasky said.
This icing flight data base allowed meteorologists at NCAR to use their forecasting and in-flight experience, as well as the cloud characterization data, to improve SLD weather forecasting techniques, including the development of the Current Icing Product (CIP) and Forecast Icing Product (FIP). These products, which are available free to the public, provide diagnoses and forecasts of icing conditions, including their probability, severity and the potential for SLD. The CIP and FIP products may be accessed via the Aviation Digital Data Service (ADDS) website <http://www.aviationweather.gov/icing>. This website also provides important information on how CIP/FIP products should be used.
The icing flight database was also provided to the FAA for use in developing new engineering standards related to airworthiness and means of compliance.
The U.S. National Transportation Safety Board (NTSB), in safety recommendations prompted by its investigation of the ATR accident and a subsequent accident that also involved flight in icing conditions, called on the FAA to “use a full range of icing conditions, including SLD, for icing certification testing. This would include freezing rain, freezing drizzle, and freezing mist.”14
In 2014, the FAA issued Advisory Circular (AC) 25-28,15 which provides acceptable means of compliance under a new Appendix O icing condition, defining the SLD icing envelope. The same year, the FAA issued amendment 25-140 to FARs Part 25.1420, which provides for certification of transport category aircraft to operate in SLD.
“The research programs led to the development of weather diagnostic and forecast tools that currently enable aircraft to strategically avoid SLD conditions,” Ratvasky said. “The research programs were also the basis for new certification standards so that new aircraft must be tested with shapes that can form in SLD encounters. Additionally, airplane flight manuals were updated to inform pilots of cues of SLD icing and procedures to mitigate the hazard if encountered. Although the ATR accident was tragic, the actions and processes that occurred since that time have reduced the likelihood of another tragic event.”
Richard J. Ranaudo was a NASA research pilot for 25 years and the lead project test pilot in the icing research program for 16 years. After retiring from NASA, he spent five years as manager of Canadair flight test programs and conducted icing development and certification testing on prototype business and regional aircraft.
Acknowledgement
Thomas P. Ratvasky of NASA and Ben C. Bernstein, formerly of NCAR and now with Leading Edge Atmospherics, were central figures and technical experts in the conduct of the joint NASA/NCAR/FAA SLD flight research program. They were in large part responsible for safe and successful execution of the program.
Notes
- NTSB. NTSB/AAR-96/02, In-Flight Icing Encounter and Loss of Control; Simmons Airlines, American Eagle Flight 4184; Roselawn, Indiana; October 31, 1994.
- Leary, W.M. NASA SP-2002-4226, We Freeze to Please, p. 1–61.
- Hareland, G.A. “Evaluation of Flour Particle Size Distribution by Laser Diffraction, Sieve Analysis and Near-Infrared Reflectance Spectroscopy.” Journal of Cereal Science, Volume 20 (September 1994): 183–190.
- Ben C. Bernstein, a meteorologist with Leading Edge Atmospherics, suggests that typical droplet sizes in each category are around 0.02 mm, 0.2 mm and 2 mm (0.00078 in, 0.0078 in and 0.078 in).
- Bernstein, B.C.; Ratvasky, T.P.; Miller, D.R.; McDonough, F. NASA/TM–2000-210058, “Freezing Rain as an In-Flight Icing Hazard.” June 2000.
- Huffman, G.J.; Norman, G.A. Jr. “The Supercooled Warm Rain Process and the Specification of Freezing Precipitation.” Monthly Weather Review Volume 116 (November 1988): 2172–2182.
- Bernstein, B.C. “Icing Meteorology.” Prepared for Embry Riddle University Aircraft Icing Short Course, Leading Edge Atmospherics, August 2015.
- FAA. “FAA Inflight Aircraft Icing Research Plan.” April 1997.
- Personal communication with Ratvasky, Thomas P.
- Miller, D.R.; Ratvasky, T.P.; Bernstein, B.; McDonough, F.; Strapp, W.J. NASA/TM–1998-206620, “NASA/FAA/NCAR Supercooled Icing Flight Research: Summary of 1996–97 Winter Flight Operations.” January 1998.
- Personal communication with Bernstein, Ben C.
- Ratvasky, T.P., “NASA Icing Flight Research with Performance and Stability and Control Considerations.” UTSI Aircraft Icing Short Course, Sept. 21, 2010.
- Personal conversation with Ratvasky, Thomas P.
- Hersman, Deborah A.P. Testimony before the aviation subcommittee of the Committee on Transportation and Infrastructure, U.S. House of Representatives. Washington. Feb. 24, 2010.
- FAA. AC 25-28, Compliance of Transport Category Airplanes with Certification Requirements for Flight in Icing Conditions. Oct. 27, 2014.
Image credits
Featured: © RayOneMedia | iStockphoto
Photo A: Thomas P. Ratvasky, U.S. National Aeronautics and Space Administration
Photo B: Thomas P. Ratvasky, U.S. National Aeronautics and Space Administration
Photo C: Kurt Blankenship, U.S. National Aeronautics and Space Administration
Photo D: Thomas P. Ratvasky, U.S. National Aeronautics and Space Administration
Photo E: U.S. National Aeronautics and Space Administration
Photo F: U.S. National Aeronautics and Space Administration
