The number and rate of reported bird strikes involving Australia’s high capacity air transport aircraft1 increased significantly in 2014 and 2015 — the last years for which final data are available, the Australian Transport Safety Bureau (ATSB) says.
In its report, Australian Aviation Wildlife Strike Statistics, 2006 to 2015, the ATSB said it received reports of 1,977 bird strikes across Australia in 2015, and of that number, 1,227 (62 percent) involved high capacity air transport aircraft. The total of 1,977 was the highest number reported in any of the 10 years covered by the report, up from 1,946 strikes in 2014 and 1,234 strikes in 2006; the 10-year total was 16,096 (Table 1).
| Operation Type | 2006 | 2007 | 2008 | 2009 | 2010 | 2011 | 2012 | 2013 | 2014 | 2015 |
|---|---|---|---|---|---|---|---|---|---|---|
| Source: Australian Transport Safety Bureau | ||||||||||
| High capacity air transport | 632 | 650 | 766 | 819 | 970 | 984 | 972 | 998 | 1,308 | 1,227 |
| Low capacity air transport | 198 | 211 | 213 | 246 | 254 | 332 | 248 | 304 | 247 | 307 |
| General Aviation | 91 | 130 | 158 | 185 | 153 | 162 | 152 | 193 | 178 | 193 |
| Military | 15 | 30 | 10 | 57 | 86 | 73 | 97 | 111 | 81 | 71 |
| Unknown | 298 | 237 | 192 | 201 | 237 | 197 | 172 | 139 | 132 | 179 |
| Total | 1,234 | 1,258 | 1,339 | 1,508 | 1,700 | 1,748 | 1,641 | 1,745 | 1,946 | 1,977 |
The 1,227 strikes involving high capacity air transport aircraft compared with 1,308 strikes in 2014 and 632 strikes in 2006.
Increases also were reported for bird strikes involving low capacity air transport aircraft, general aviation aircraft and military aircraft, the report said, noting that a decrease was seen only in the number of strikes reported in the category of unknown aircraft. Most reports involving unknown aircraft were submitted by airport operators who found bird remains, and the report said the decrease in that category, coupled with increases in specific aircraft categories, might indicate an improvement in the quality of data received by the ATSB.
Low capacity air transport aircraft were involved in 307 reported bird strikes in 2015, compared with 247 in 2014 and 198 at the start of the reporting period, in 2006, the report said.
Data also showed 193 bird strikes were reported involving general aviation aircraft, compared with 178 strikes in 2014 and 91 in 2006. Military aircraft were involved in a reported 71 bird strikes in 2015, compared with 81 strikes the previous year and 15 strikes at the start of the 10-year reporting period.
The annual rate of bird strikes for high capacity air transport aircraft rose steadily throughout the 10-year period, the report said, adding, “It is likely that the speed and size of these aircraft, longer takeoff and landing rolls and large turbofan engines are factors contributing to the higher rate.”
Data showed a 2015 rate of 8.96 strikes per 10,000 movements, down from the 10-year high of 9.57 per 10,000 movements recorded in 2014 but well above the 2006 rate of 6.8 per 10,000 movements (Table 2).
| Operation Type | 2006 | 2007 | 2008 | 2009 | 2010 | 2011 | 2012 | 2013 | 2014 | 2015 |
|---|---|---|---|---|---|---|---|---|---|---|
| Source: Australian Transport Safety Bureau | ||||||||||
| High capacity air transport | 6.8 | 6.73 | 7.13 | 7.58 | 8.26 | 8.05 | 7.3 | 7.35 | 9.57 | 8.96 |
| Low capacity air transport | 1.23 | 1.26 | 1.38 | 1.67 | 1.6 | 2.09 | 1.53 | 1.99 | 1.89 | — |
| General Aviation | 0.25 | 0.36 | 0.4 | 0.5 | 0.38 | 0.44 | 0.43 | 0.53 | 0.48 | — |
The 2015 bird strike rates were not available for low capacity air transport aircraft and general aviation aircraft; 2014 rates were 1.89 per 10,000 movements for low capacity and 0.48 for general aviation aircraft.
Helicopters were involved in 32 reported bird strikes in 2015, compared with 30 strikes in 2014 and 10 in 2006, the report said (Table 3). In 2014 and 2015, the lightest-weight helicopters — those weighing less than 2,250 kg (4,960 lb) — were involved in most of the strikes.
| Maximum Weight Category | 2006 | 2007 | 2008 | 2009 | 2010 | 2011 | 2012 | 2013 | 2014 | 2015 |
|---|---|---|---|---|---|---|---|---|---|---|
| Source: Australian Transport Safety Bureau | ||||||||||
| 27,001–272,000 kg | 0 | 0 | 0 | 0 | 0 | 0 | 0 | 0 | 0 | 0 |
| 5,701–27,000 kg | 2 | 2 | 0 | 9 | 8 | 10 | 11 | 18 | 10 | 9 |
| 2,251–5,700 kg | 2 | 16 | 13 | 13 | 10 | 7 | 6 | 14 | 8 | 9 |
| Less than 2,250 kg | 6 | 5 | 7 | 12 | 12 | 8 | 5 | 17 | 12 | 14 |
| Total | 10 | 23 | 20 | 34 | 30 | 25 | 22 | 49 | 30 | 32 |
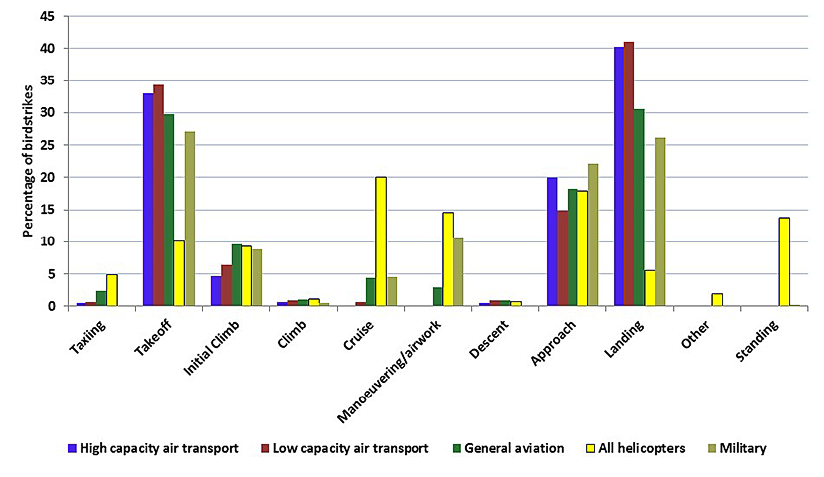
For all categories of airplanes, bird strikes over the 10-year period were far more likely during takeoff and landing than in other phases of flight; helicopters, however, were mostly likely to report bird strikes during cruise flight (Figure 1).
Figure 1 — Proportion of Bird Strikes by Phase of Flight and Operation Type, Aggregated for the 2006–2015 Period

Source: Australian Transport Safety Bureau
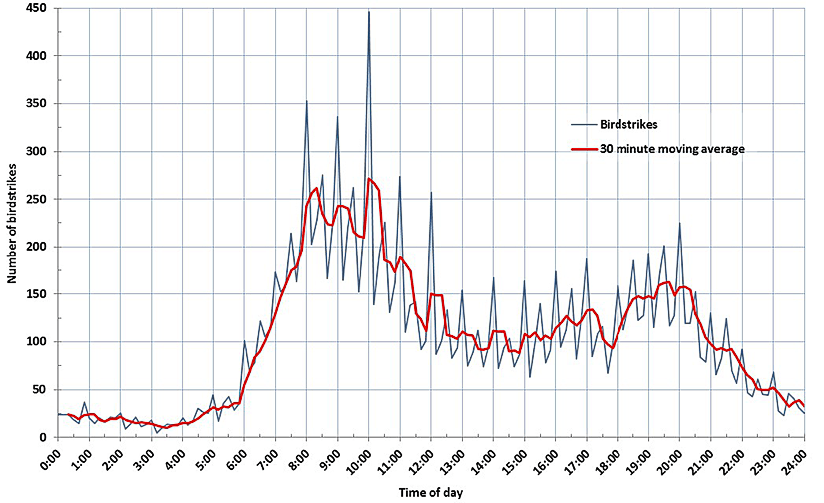
At most airports across Australia, bird strikes were most common between 0730 and 1030 local time (Figure 2). “In general, the likelihood for a bird strike is determined by the bird activity and aircraft activity in and around airports,” the report said. “Major airports, in particular, have weekday peak movement times in the mornings and evenings, which heavily influence the twin peaks seen in [Figure 2].”
Figure 2 — Number of Bird Strikes by Time of Day, Aggregated for the 2006–2015 Period

Source: Australian Transport Safety Bureau
Most bird strikes in which a bird was ingested into an engine were reported to involve turbofan engines, the report said, noting that an ingestion occurred in one in every 10 strikes involving turbofan engine aircraft.
High capacity aircraft were involved in nearly 80 percent of all ingestion strikes — a total of 720 over the 10-year period, the report said (Table 4). Data show that of the 720 ingestions, seven were cases in which birds were ingested into both engines.
| Operation Type | High Capacity Air Transport | Low Capacity Air Transport | General Aviation | Unknown | Total | |||
|---|---|---|---|---|---|---|---|---|
| 1 Engine | 2 Engines | 1 Engine | 2 Engines | 1 Engine | 1 Engine | 1 Engine | 2 Engines | |
| Source: Australian Transport Safety Bureau | ||||||||
| 2006 | 63 | 3 | 8 | 0 | 0 | 1 | 72 | 3 |
| 2007 | 74 | 0 | 14 | 0 | 3 | 1 | 95 | 0 |
| 2008 | 76 | 1 | 20 | 1 | 5 | 0 | 101 | 3 |
| 2009 | 71 | 2 | 6 | 0 | 1 | 0 | 85 | 2 |
| 2010 | 82 | 0 | 6 | 0 | 2 | 0 | 98 | 2 |
| 2011 | 82 | 0 | 10 | 1 | 2 | 1 | 106 | 1 |
| 2012 | 81 | 0 | 6 | 0 | 1 | 0 | 101 | 0 |
| 2013 | 55 | 0 | 11 | 0 | 3 | 0 | 78 | 0 |
| 2014 | 67 | 0 | 5 | 0 | 2 | 0 | 77 | 1 |
| 2015 | 62 | 1 | 11 | 0 | 5 | 4 | 83 | 1 |
| Total | 713 | 7 | 97 | 2 | 24 | 4 | 896 | 13 |
Notes
- High capacity air transport aircraft include regular public transport and charter aircraft that seat more than 38 people or carry a maximum payload of more than 4,200 kg (9,259 lb).Low capacity air transport aircraft are those with fewer seats or smaller payloads.
- ATSB. Transport Safety Report AR-2016-063, Australian Aviation Wildlife Strike Statistics, 2006 to 2015. Feb. 1, 2017.


