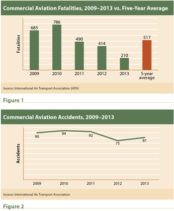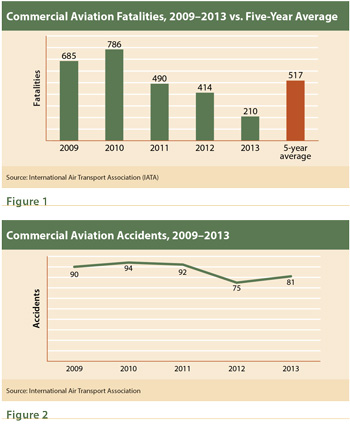
Commercial aviation, including both jet and turboprop operations, suffered 16 fatal accidents in 2013 that resulted in 210 fatalities, according to worldwide data released in early April by the International Air Transport Association (IATA). While there was one more fatal accident last year than there was in 2012, the number of fatalities in 2013 fell sharply from 2012’s total of 414, IATA said. In addition, last year marked the third consecutive year in which fatalities declined from the previous year, and 2013’s fatality total was less than half of the annual average over the five-year — 2009–2013 — period (Figure 1).
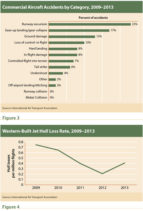
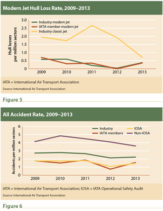
Overall, there were 81 commercial aviation accidents involving Eastern- and Western-built aircraft last year, up from 75 in 2012, but still fewer than in any of the previous three years (Figure 2). Of the 81 accidents, 78 percent involved passenger operations, 18 percent cargo operations and 4 percent ferry flights. Just over half of the accidents, 53 percent, involved turboprops. Twenty-one percent of last year’s accidents involved a runway excursion, 17 percent a gear-up landing or gear collapse, and 15 percent involved ground damage.
IATA defines an accident as an event in which persons have boarded an aircraft with the intention of flight; the intention of the flight is limited to normal commercial aviation activities, specifically scheduled or charter passenger or cargo service; the aircraft is turbine-powered and has a certificated maximum takeoff weight of at least 5,700 kg (12,500 lb); and the aircraft has sustained major structural damage exceeding $1 million or 10 percent of the aircraft’s hull reserve value, whichever is lower, or it has been declared a hull loss.
Over the past five years, there have been 432 commercial aviation accidents, or an average of 86.4 per year. During that period, there were 94 fatal commercial aircraft accidents. Sixty-five percent involved passenger operations, 31 percent cargo operations and 4 percent ferry flights, according to IATA.
Runway excursions were the most common type of accident during the 2009–2013 period, accounting for 23 percent of all the accidents, IATA said (Figure 3). Those accidents, however, accounted for only 8 percent of 2,585 fatalities during the period.
“Improving runway safety is a key focus of the industry’s strategy to reduce operation risk,” IATA said. “Information sharing, risk analysis, training and analysis of the taxonomy of runway safety are all part of the industry’s comprehensive approach to improvement in this area.” From 2009 to 2013, 58 percent of all accidents occurred in the runway environment, IATA said.
Approximately 10 percent of all the commercial aviation accidents over the past five years have been categorized as loss of control–in flight (LOC-I), according to IATA. “While few in number, LOC-I accidents almost always are catastrophic,” IATA said. Ninety-five percent of the LOC-I accidents during the five-year period involved fatalities to passengers or crew. Of the 2,585 fatalities suffered in commercial aviation in 2009–2013, 1,546, or 59.8 percent, were as a result of LOC-I accidents. Last year, there were eight LOC–I accidents, and all of them involved fatalities.
There were six controlled-flight-into-terrain (CFIT) accidents in 2013, and 7 percent of all accidents in 2009–2013, or 31, were CFIT, according to IATA data. The association said that most CFIT accidents occur in the approach and landing phase of flight and are often associated with nonprecision approaches. Over the past five years, 52 percent of CFIT accidents were known to involve the lack of a precision approach. “There is a very strong correlation between the lack of instrument landing systems or state-of-the-art approach procedures, such as performance-based navigation (PBN), and CFIT accidents,” IATA said, adding that it has established a campaign for states to expedite the implementation of PBN approach procedures for runways lacking precision approaches.
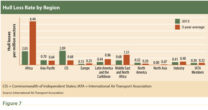
IATA calculated the Western-built jet hull loss rate for 2013 at 0.41 per million flights, or the equivalent of one per every 2.4 million flights, which is nearly double 2012’s rate of 0.21 hull losses per million flights (Figure 4). There were 12 hull loss accidents involving Western-built jets last year, compared to six in 2012. Last year’s hull loss rate of 0.41 per million, however, still is lower than the five-year (2009–2013) average of 0.48 hull losses per million flights. A hull loss is defined as an accident in which the aircraft is destroyed or substantially damaged and not subsequently repaired for whatever reason, including a financial decision by the owner.
With the release of its most recent statistics, IATA introduced a new measure for accidents, the modern jet hull loss rate. This includes aircraft approved for production after 1985 and equipped with a glass cockpit and flight management system at initial certification. Aircraft using older technologies are considered “classic.” IATA said this definition “reflects the harmonizing of aircraft manufacturing and certification standards and the global manufacturing of aircraft components.” The modern jet hull loss rate is calculated as the number of accidents per million flights or sectors. IATA also calculated the modern jet hull loss rate for the industry as a whole and separately for IATA member carriers.
According to IATA, the classic jet hull loss rate last year was 0.71 per million sectors, while the overall industry rate was 0.38 per million and the IATA member carrier rate was 0.36 per million (Figure 5).
The most comprehensive of the rates calculated by IATA is the all accident rate, which includes substantial damage and hull loss accidents for jets and turboprops. The industry all accident rate last year was 2.23 accidents per million fights, which represents a slight increase from 2012 (Figure 6). The IATA member carrier all accident rate was 1.57 per million flights in 2013, up from 0.74 the previous year and also greater than the five-year average rate of 1.49. The accident rate last year for operators that are IATA Operational Safety Audit (IOSA)–registered was 1.46 accidents per million flights, and the rate for non-IOSA-registered operators was 3.6 per million. The five-year average rate for IOSA operators is 1.57 per million, while the five-year average rate for non-IOSA-registered operators is 4.24 per million. IOSA is an industry standard for airline operational safety auditing that assesses airline operational management and control systems and, as of March 2009, is a condition of IATA membership.
The Commonwealth of Independent States had the worst performance of any region in terms of the Western-built hull loss rate in 2013 (Figure 7), followed by Africa. North Asia, Europe and North America had the lowest rates, all well below the industry average of 0.41 hull losses per million flights. IATA member carriers as a group also fell below the industry average. Over the past five years, Africa had the highest average hull loss rate, followed at a distance by the Middle East and North Africa. North Asia and North America had the lowest rates.
