Aircraft icing occurs only in clouds that have certain properties conducive to ice formation. Ice protection systems are designed to prevent airframe ice from forming on critical surfaces such as wings and tails — or to remove it. However, if the ice protection system fails to perform its function, or if human error occurs in its operation, a hazardous flight condition can result.
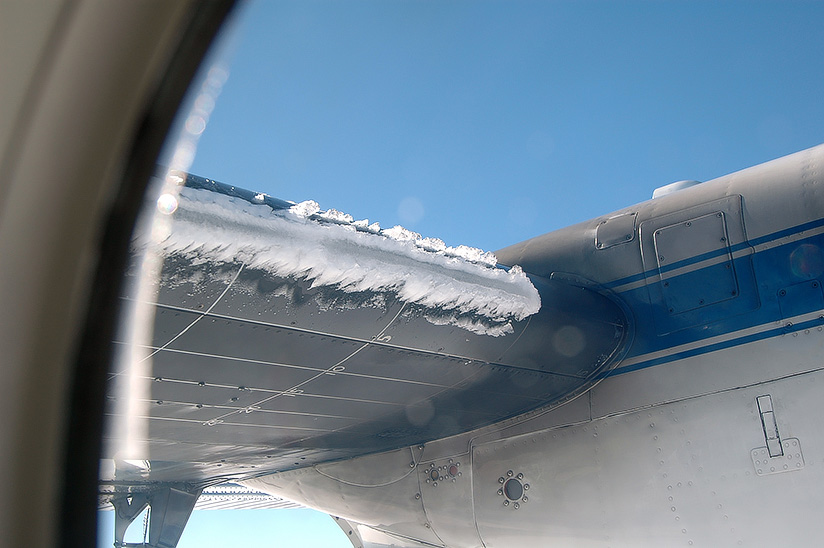
The shape of ice formed on an aircraft surface depends on the interaction of cloud properties such as temperature, liquid water content and drop size. The accumulation rate and the size of the ice shape depend on these factors, and also on aircraft speed and the length of time that an aircraft spends in icing conditions. Three general ice types can result from this interaction: glaze ice (clear), rime ice (cloudy and opaque) and mixed ice (with a combination of glaze and rime characteristics; Figures 1a, 1b and 1c).1
Figure 1a — Glaze (Clear) Ice, 0 to Minus 5° C
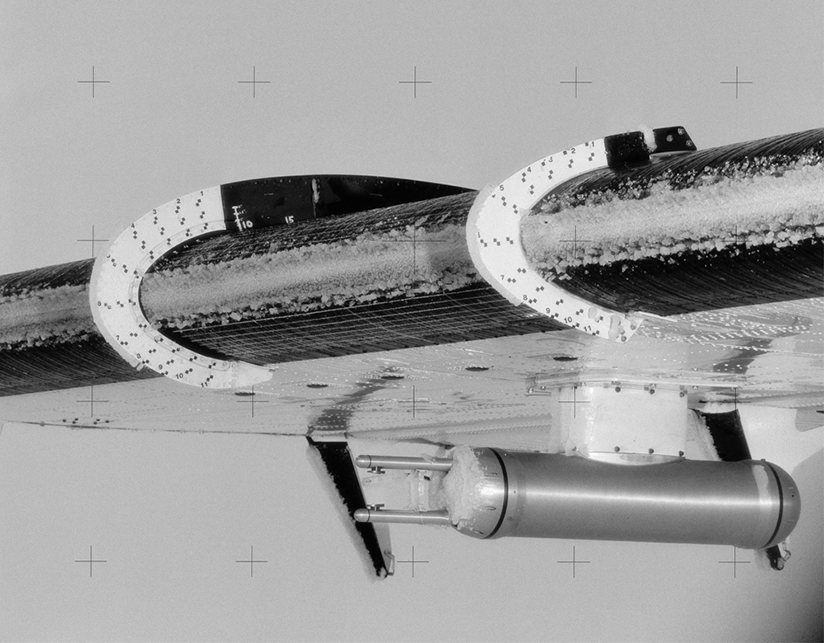
Figure 1b — Mixed Ice, Minus 5 to Minus 10° C
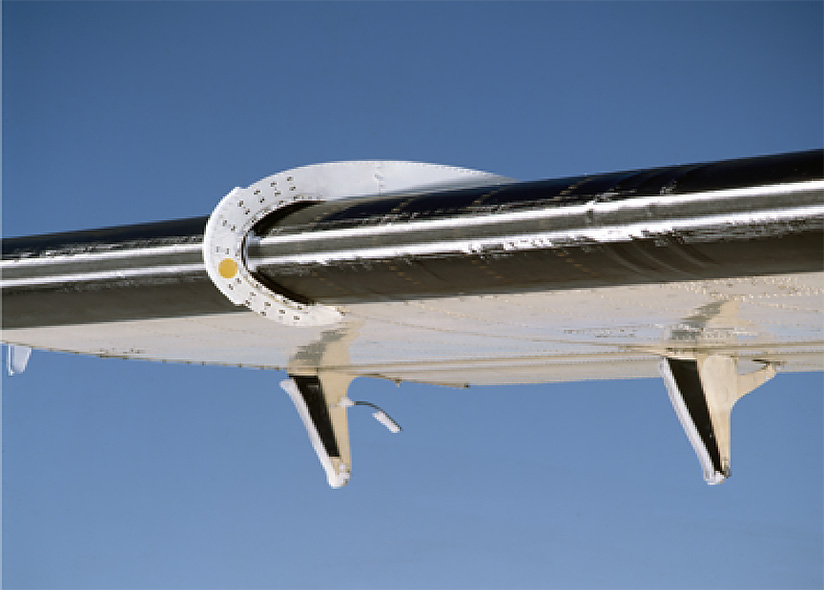
Figure 1c — Rime Ice, Minus 10° C and Below
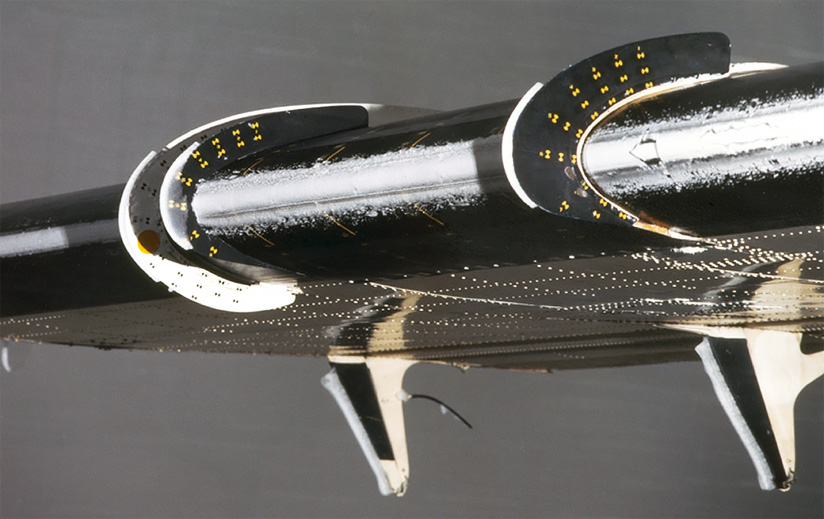
The U.S. National Aeronautics and Space Administration (NASA) was spurred on to engage in new icing research by a 1978 international icing workshop aimed at identifying areas where new icing technology was needed.2 Added impetus came from the Jan. 13, 1982, crash of an Air Florida Boeing 737 after takeoff from Washington. Seventy-four of the 79 people in the airplane and four people on the ground were killed in the crash, which the U.S. National Transportation Safety Board said occurred because the flight crew failed to use engine anti-ice before takeoff and to properly deice airfoil surfaces.3
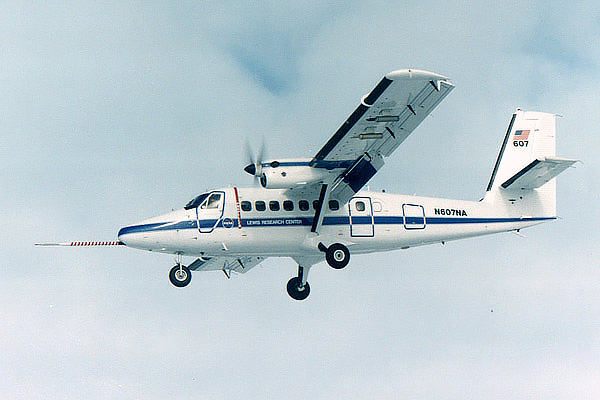
The accident brought more focus to the hazard of aircraft icing, and as a result, new areas of icing research began to take shape. The need for a test aircraft to support the research program was emphasized by the NASA aviation safety program manager, and in 1982, a De Havilland DH-6 Twin Otter aircraft, Figure 2, was transferred to NASA’s Lewis Research Center (LeRC) to become the flight research vehicle. So began a new era in NASA icing flight research.
Figure 2 — NASA Twin Otter Icing Research Aircraft
At the outset of the program in 1984, the emphasis was on measurement of icing cloud data, but testing soon was expanded to include aircraft performance loss related to those measured conditions. It was decided that two-dimensional cross sectional shapes of wing ice formations could be obtained using a stereo camera arrangement.4 Additional pneumatic deicing boots were added to the vertical tail, wing struts and landing gear fairings. Together, these modifications enabled researchers to associate the properties of an icing cloud with the ice shape formed on the wing, and to evaluate aircraft performance losses due to ice formations on various airframe components. Gaining a better understanding of icing effects on aircraft performance and handling characteristics was now a major focus of NASA’s in-flight icing research program.
Flight Testing
The practice was to establish the Twin Otter in an icing cloud with all ice-protection systems turned off except propeller and pitot-static anti-icing. Icing cloud data would be recorded as the aircraft orbited in a holding pattern at a specified speed and altitude while accumulating ice. When a sufficient amount of ice formed, the aircraft would climb above the clouds — and with the airframe completely iced up, measurements of speed vs. power would be made, along with measuring the angle-of-attack. At the same time, stereo photos would be taken of the wing ice shape. Test points were conducted from the highest speed attainable in level flight with full engine power to the lowest level flight speed just above stall onset. Depending on the profile in the test plan, the test would be repeated with successive deicing of wings, tail and struts. After flight, performance data would be analyzed and referenced to the icing cloud characteristics.
Aircraft performance loss is the result of the shape and amount of ice that forms on an aircraft.5 Two flights, summarized in Table 1, are compared to illustrate how some of these factors come into play.
| Research Flight Number | Flight 83-10 | Flight 83-11 |
|---|---|---|
| Source: Richard J. Ranaudo | ||
| Type of ice | Glaze | Mixed |
| Time in icing conditions | 26 minutes | 46 minutes |
| Ice shape | Rough, double-ridged | Smooth, conformal |
| Total air temperature | Minus 2.3 degrees C (28 degrees F) | Minus 8.9 degrees C (16 degrees F) |
| Average liquid water content | 0.31 grams per cubic meter | 0.29 grams per cubic meter |
| Droplet size | 13 microns | 13 microns |
| Stall speed increase — all ice | 23 percent | 16 percent |
| Stall speed increase — wing deiced | 10 percent | Negligible |
| Drag increase — all ice | 45 percent | 17 percent |
| Drag increase — wing deiced | 33 percent | 7 percent |
| Drag increase — tail deiced | 28 percent | 3 percent |
Flight 83-10 was flown in a glaze icing condition, and the wing ice shape was similar to that shown in Figure 1a. Flight 83-11 was flown in a mixed icing condition, and the wing ice shape was similar to that shown in Figure 1b.
The main difference between the icing cloud properties on the two flights was the total air temperature (TAT), which was warmer on Flight 83-10, causing the water droplets to run back a little before freezing. This resulted in a rough, double-ridged shape.
TAT was colder on Flight 83-11, causing the water droplets to run back less before freezing. This resulted in a smooth and conformal shape.
The 6.6-degree C (12-degree F) temperature difference resulted in different ice shapes and significantly different performance losses. For example, stall speed increase was 1.5 times greater in glaze ice vs. mixed-ice conditions. Drag increase was more than double in the glaze vs. mixed condition. These decrements in lift and drag translate into safety-of-flight considerations. Should ice-protection systems fail, an immediate altitude change may be required to get out of the icing cloud.
Icing in stratiform clouds is generally the most intense within the highest 500 ft of the clouds. Assessing ice type according to its shape is important. If it is glaze ice and the wings cannot be deiced, pilots should anticipate a 20 to 25 percent increase in stall speed and adjust approach and landing speeds accordingly.
Pilots also must consider climb performance, and what would happen if an engine failed.
Climb rate primarily depends on the ratio of excess power available to the power required for a given condition of flight. Power required depends mostly on drag. As shown in Table 1, with glaze ice, there was still a 28 percent drag increase due to ice on unprotected parts of the airframe, as well as residual ice left on the wings and tail after deicing.
An analysis of excess power available vs. power required using flight data from Flight 83-10 was performed assuming an engine failure at 6,000 ft. The analysis showed that even with the tails deiced, the aircraft would have been able to sustain level flight only by flying at a speed coincident with stall speed — a difficult condition to maintain. When planning a flight over high terrain with a propeller-driven twin-engine aircraft, pilots would find it operationally prudent to consider forecast icing and single-engine climb performance in case of an engine failure.
Tailplane Icing
Ice formations on the horizontal tail of certain aircraft are known to cause pitch handling problems, especially in a landing configuration. The Twin Otter was known to have these problems, making it an ideal aircraft for investigating the aerodynamic effects of tailplane icing.
In 1985, an initial evaluation of tailplane icing on pitch stability and controllability was conducted by NASA and Kohlman Systems Research.6 Several test flights were conducted in natural icing conditions, employing dynamic maneuvers and a performance modeling method to analyze how ice formations degraded important aerodynamic variables.
Longitudinal stability, elevator effectiveness and pitch damping are perhaps the most important variables affecting longitudinal aircraft handling. All were degraded to varying degrees depending on the type of ice formation, wing flap position and engine power.
Wing flap angle, though restricted to 10 degrees, was the most significant configuration factor affecting handling issues. This initial research provided a good transition into what was a far more important issue at the time — the ice-contaminated tailplane stall (ICTS). Since the late 1950s, 16 accidents and 139 fatalities have been attributed to ICTS.7 Generally, the accident scenario has involved an approach with an ice-contaminated horizontal tailplane. On short approach at low altitude, when landing flaps were extended, the aircraft pitched nose down and crashed. The problem was addressed by a number of international workshop groups, and the eventual outcome was that the U.S. Federal Aviation Administration (FAA) requested that NASA “conduct research into the characteristics of ICTS, and develop techniques and methodologies to minimize the hazard.”8
Thus began a four-year NASA/FAA Tailplane Icing Program (TIP), whose goals were to develop a technical understanding of ICTS factors, and also to develop recognition and recovery training aids for pilots.
Risk Mitigation
NASA recognized that while conducting the TIP flights, a full ice-contaminated tail stall was possible, and this critical safety issue had to be mitigated prior to the flight tests. There had to be positive assurance that the aircraft would recover from an ICTS event. The expected suddenness and extreme dynamics of the tail stall made attitude recovery and/or crew escape systems impractical. The only reasonable mitigation depended on taking a very methodical “build-up” approach to the event. This would allow time to gain a good understanding of tailplane stall aerodynamic factors, pre-tail stall aircraft behavior, and verification of ICTS recovery procedures.
Safety risk mitigation began by testing a full-scale Twin Otter horizontal tailplane in the LeRC Icing Research Tunnel (IRT) to obtain the ice shapes for the flight program. IRT testing provided two of the three ice accretion shapes: an “inter-cycle” ice accretion representing residual ice after deicing and a “failed boot” ice accretion representing a 22-minute icing encounter with no deicing. Urethane castings of these shapes were then tested on the full-scale tailplane in The Ohio State University Low Speed Wind Tunnel. Detailed aerodynamic data and tail stall conditions were recorded. From these data, a cockpit display was developed, which gave the pilot a digital readout of the angle-of-attack margin to tail stall. The intent was to provide an early warning to the pilot when ICTS was imminent. A third shape used in previous stability and control flight programs was made of Styrofoam and called the “S&C” ice shape. The three shapes and the flight test fixture on the Twin Otter are shown in Figure 3. The probes seen in the figure were used to measure airspeed and tail angle-of-attack. A perforated belt between the inside and middle probes was used to measured upper and lower tailplane surface pressure.
Figure 3 — Ice Shapes for Flight Testing Installations
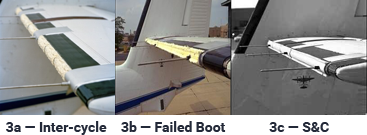
Note: Tests involved three distinct ice shapes.
Source: Thomas Ratvasky and Kurt Blankenship, NASA Glenn Research Center
Reaching the ICTS Test Condition
The flight test to the ICTS was preceded by aircraft handling and aerodynamic data acquisition testing. The “inter-cycle” shape was tested first, followed by the “failed boot” case. The S&C ice shape also was tested but the test was limited to a wing flap angle less than fully extended.
The initial testing was conducted to understand the effect that the ice shapes had on the function of the tailplane; different test maneuvers were performed to assess these effects. These included wing flap transitions, power transitions and speed transitions with the transitions beginning in a benign condition and slowly and controllably progressing to a more severe state. For example, a flap transition began with flaps up and slowly transitioned to full extension. A power transition began in a given configuration at a given speed, and after the airplane was stabilized, power was gradually increased to full. At any point, the transition could be stopped if flight characteristics were of concern. Dynamic maneuvers also were performed, such as the FAA’s “0 g pushover maneuver” to assess tendency for tail stall, and small but rapid up-and-down elevator inputs to assess pitch response.
Lessons learned in this testing included:
- For all three ice shapes, as the aircraft speed was increased toward the maximum allowable speed for a given flap angle, the margin to tail stall was reduced.
- Elevator angle for level flight trim increased with ice; in some icing and wing flap configurations, it was not possible to trim the elevator for level flight.
- As flap angle increased, the aircraft became more unstable and pitch damping was reduced.
- With higher wing flap settings, as engine power was increased, pulsation of the elevator also increased and the aircraft response became more unstable.
- The aircraft immediately recovered from an unstable and minimally controllable flight condition at high power immediately after engine power was reduced to idle.
After 34 test flights over two years, NASA felt confident that the understanding of aircraft characteristics, the employment of the power transitions maneuver, and the reliability of the recovery procedure had mitigated the ICTS safety risk to an acceptable level. Testing then proceeded to the ICTS test condition.
The Twin Otter was configured with the “failed boot” ice shape replicator. The aircraft was flown to 7,300 ft, power on both engines was reduced to idle, the wings flaps were fully extended, and the aircraft was trimmed for 85 kt. The throttles were slowly advanced, and as approximately half power was reached, the elevator control started pulsating with corresponding oscillations in pitch. Elevator force to prevent a pitch-down began increasing as power was increased, and varied randomly between 40 and 60 lb (18 to 27 kg). It was impossible to stop the pitch oscillations. As the throttles approached full, the pulsations increased in intensity, and elevator forces reached approximately 100 lb (45 kg). Throttle movement was stopped short of full power, and suddenly the nose pitched over violently, and the crew was weightless for a few moments. The pilot held approximately 180 lb (82 kg) of force on the control yoke to keep the elevator from going to the forward stop. As soon as the stall occurred, the throttles were immediately pulled to idle, the copilot set the wing flap lever to full up, and the aircraft immediately recovered from the tail stall. The entire sequence from pitch over to recovery took about 2.5 seconds. In that time, the nose had pitched over at 10 degrees per second to a 36-degree nose-down attitude before recovery occurred. Approximately 300 ft of altitude were lost in the maneuver.
NASA completed its program objectives in this extensive four-year program, and in the process, created training materials that have been widely disseminated to the public. The FAA, which provided support and funding for the program, incorporated much of what was learned into two advisory circulars9,10 describing acceptable means of complying with icing certification rules under Federal Aviation Regulations Parts 23 and 25. As described in the May 2016 issue of AeroSafety World, an aircraft icing short course is still offered by Embry Riddle Aeronautical University.11 A large portion of the training syllabus was derived from NASA icing research programs.
Richard J. Ranaudo was a NASA research pilot for 25 years and the lead project test pilot in the icing research program for 16 years. After retiring from NASA, he spent five years as manager of Canadair flight test programs and conducted icing development and certification testing on prototype business and regional aircraft.
Notes
- Ratvasky, T.P.; Blankenship, K.S. “Presentation for University of Tennessee Aircraft Icing Short Course.” NASA Glenn Research Center, Sept. 21, 2010.
- Leary, W.M. NASA SP-2002-4226, “We Freeze to Please: A History of NASA’s Icing Research Tunnel and Quest for Flight Safety.” 2002.
- NTSB. NTSB-AAR-82-8, Air Florida, Inc., Boeing 737-222, N62AF, Collision with 14th Street Bridge, Near Washington National Airport, Washington, D.C., January 13, 1982. Aug. 10, 1982.
- Mikkelson, K.L.; McKnight, R.C.; Ranaudo, R.J.; Perkins, P.J. Jr. NASA-TM-86906, “Icing Flight Research: Aerodynamic Effects of Ice and Ice Shape Documentation With Stereo Photography.” 23rd Aerospace Sciences Conference, AIAA, Jan. 14–17, 1985.
- Ranaudo, R.J.; Mikkelson, K.L.; McKnight, R.C.; Perkins, P.J. Jr. NASA-TM-83564, “Performance Degradation of a Typical Twin Engine Commuter Type Aircraft in Measured Natural Icing Conditions.” 1984.
- Ranaudo, R.J.; Mikkelson, K.L.; McKnight, R.C.; Ide, R.F.; Reehorst, A.L.; Jordan, J.L.; Schinstock, W.C.; Platz, S.J. NASA TM-87265, AIAA-86-9758, “The Measurement of Aircraft Performance and Stability and Control After Flight Through Natural Icing Conditions.” April 2–4, 1986.
- Ratvasky, T.P.; Van Zante, J.F.; Riley, J.T. NASA TM-1999-208901, “NASA/FAA Tailplane Icing Program Overview.” 37th Aerospace Sciences Meeting, AIAA, Reno, Nevada, U.S. Jan. 11–14, 1999.
- Ratvasky, T.P.; Van Zante, J.F.; Simm, A. NASA TP-2000-209908, “NASA/FAA Tailplane Icing Program: Flight Test Report.” March 2000.
- FAA. Advisory Circular (AC) 23.1419-2D, Change 1, “Certification of Part 23 Airplanes for Flight in Icing Conditions.” June 28, 2007.
- FAA. AC 25.1419-1, Change 1, “Certification of Part 25 Transport Category Airplanes for Flight in Icing Conditions.” Aug. 18, 1999.
- Ranaudo, R.J. “Simulating Encounters with Ice.” AeroSafety World Volume 11 (May 2016): 28–32.
Featured image: U.S. National Aeronautics and Space Administration


