
The number of aviation accidents and fatalities involving commercial air transport aircraft, as well as the associated accident rate, declined in 2016 to 75 accidents, 182 fatalities and a global accident rate of 2.1 per million departures (Figure 1), the International Civil Aviation Organization (ICAO) says.1
Figure 1 — Accidents, Scheduled Commercial Air Transport, 2012–2016
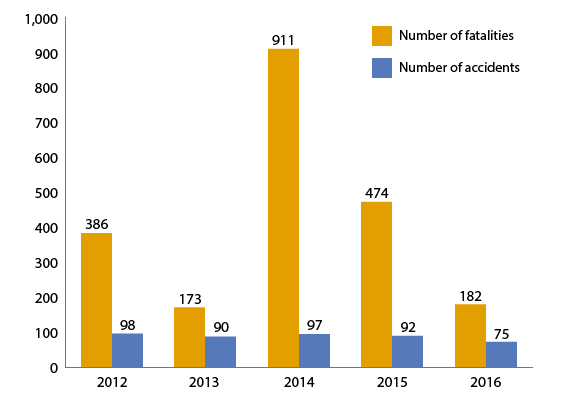
ICAO = International Civil Aviation Organization
Source: ICAO Safety Report, 2017 Edition
The accident rate, which declined 25 percent from the 2015 rate of 2.8 accidents per million departures, was the lowest ever recorded for scheduled commercial operations in fixed-wing aircraft with a maximum takeoff weight of more than 5,700 kg (12,566 lb), ICAO said in the 2017 edition of its annual Safety Report.
In the report, ICAO said that accident data for 2012 through 2016 showed a downward trend that was interrupted in 2014 and 2015 by “a spike in fatalities due to a number of acts of unlawful interference that resulted in a large number of casualties.”2
Examining 2016 accident data according to five regions of the world, ICAO found a sharp decline in the accident rate in the Africa region, from 7.3 per million departures in 2015 to 1.2 per million departures in 2016, but cautioned that the change “illustrates the volatile nature of this statistic due to the small number of departures in this region.” Africa departures accounted for 2.5 percent of the world’s traffic, the report said. Overall, one fatal accident, with one fatality, was recorded in Africa in 2016, the report said (Table 1).
| RASG Region | Estimated Departures (millions) | Number of Accidents | Accident Rate (per million departures) |
Fatal Accidents | Fatalities | Share of Traffic | Share of Accidents |
|---|---|---|---|---|---|---|---|
| AFI = Africa; APAC = Asia and Pacific; EUR = Europe; ICAO = International Civil Aviation Organization; MID = Middle East; PA = Pan America; RASG = Regional Aviation Safety Group
*Scheduled commercial air transport Source: ICAO Safety Report, 2017 Edition |
|||||||
| AFI | 0.9 | 1 | 1.2 | 1 | 1 | 2.5% | 1.3% |
| APAC | 10.7 | 19 | 1.8 | 2 | 50 | 30.7% | 25.3% |
| EUR | 8.7 | 24 | 2.8 | 2 | 64 | 24.% | 32.0% |
| MID | 1.3 | 3 | 2.3 | 2 | 67 | 3.7% | 4.0% |
| PA | 13.3 | 28 | 2.1 | 0 | 0 | 38.1% | 37.3% |
| World | 34.9 | 75 | 2.1 | 7 | 182 | — | — |
The Pan America region recorded the most air traffic, with 13.3 million departures in 2016, and the most accidents — 28, none of them fatal — for an accident rate of 2.1 per million departures, the report said. The Pan America region accounted for 38.1 percent of worldwide air traffic and 37.3 percent of the world’s total accidents.
Worldwide, there were 34.9 million departures and 75 accidents, including seven fatal accidents, the report said.
When accident data were analyzed according to the Global Safety Information Exchange (GSIE) harmonized accident rate system, the results were somewhat different. Some 113 accidents met the “harmonized accident criteria” established by GSIE, which was developed beginning in 2011 by ICAO and the International Air Transport Association to “align accident definitions, criteria and analysis methods,” the report said.
The 113 accidents involved both scheduled and nonscheduled commercial flights, including ferry flights, for aircraft with maximum certificated takeoff weights of more than 5,700 kg.
When the 113 accidents were analyzed according to category, more were classified as runway safety events, (41 accidents, or 36 percent), than as any other type of event (Figure 2); the runway safety category includes excursions and incursions, along with undershoot/overshoot, tail strike and hard landing events, the report said.
Figure 2 — Accidents, by Category*
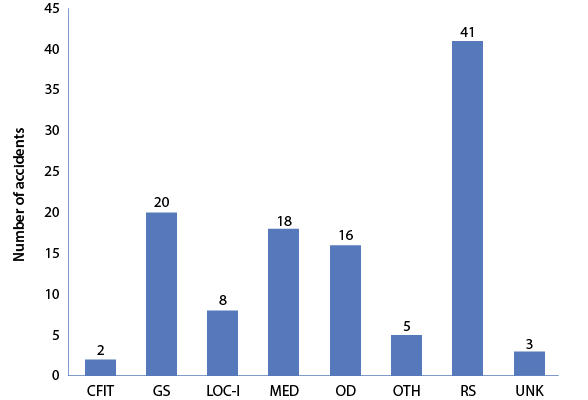
CFIT = controlled flight into terrain; GS = ground safety; ICAO = International Civil Aviation Organization; LOC-I = loss of control-in flight; MED = injuries to and/or incapacitation of persons; OD = operational damage; OTH = other; RS = runway safety; UNK = unknown
*Scheduled commercial air transport
Source: ICAO Safety Report, 2017 Edition
In second place were ground safety accidents, a category that the report said includes ramp safety, ground collisions, ground servicing, preflight, engine start/departure, arrival, and taxi and towing events. These accounted for 20 (18 percent) of the total, followed by “injuries to and/or incapacitation of persons,” in 18 accidents (16 percent), the report said.
More accidents (44, or 39 percent) occurred in the Pan America region than any other region (Figure 3), but the accident rate of 7.37 per million flight sectors, was highest in the Middle East region (Figure 4).
Figure 3 — GSIE Accidents
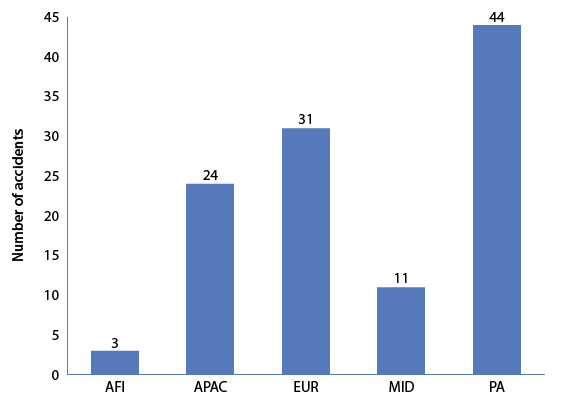
AFI = Africa; APAC = Asia and Pacific; EUR = Europe; GSIE = Global Safety Information Exchange; ICAO = International Civil Aviation Organization; MID = Middle East; PA = Pan America
Source: ICAO Safety Report, 2017 Edition
Figure 4 — GSIE Accident Rate
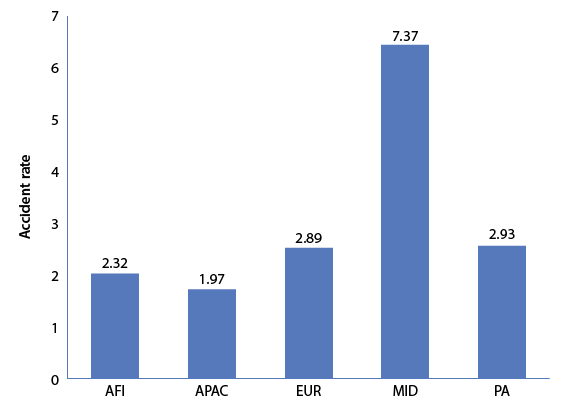
AFI = Africa; APAC = Asia and Pacific; EUR = Europe; GSIE = Global Safety Information Exchange; ICAO = International Civil Aviation Organization; MID = Middle East; PA = Pan America
Source: ICAO Safety Report, 2017 Edition
NoteS
- ICAO. Safety Report, 2017 Edition.
- These acts included the July 17, 2014, crash of a Malaysia Airlines Boeing 777 that was shot down over eastern Ukraine, killing all 283 passengers and crew; and the March 24, 2015, crash of a Germanwings Airbus A320, which investigators said was intentionally flown into the ground in the French Alps by its first officer, killing all 150 passengers and crew.