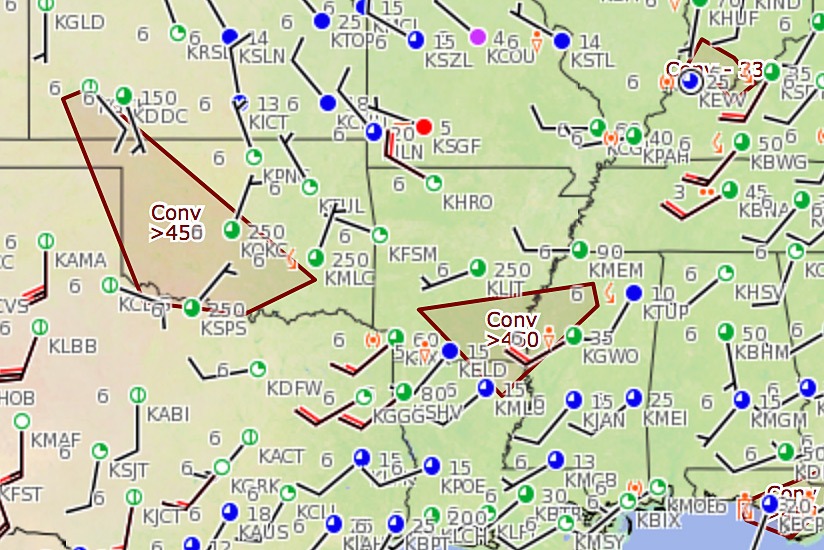
Because of the severe flight hazards associated with convection (turbulence, wind shear, hail and lightning), meteorologists are constantly trying to improve convective forecasts. In spring 2017, two new tools were added to the weather safety arsenal: the traffic flow management (TFM) convective forecast (TCF) and the graphical forecasts for aviation (GFA).
TCF, launched by the National Weather Service (NWS), is available from March 1 until the end of the convective season on Oct. 31; it replaced the collaborative convective forecast product (CCFP) but has a similar format.
The TCF is intended to provide “timely delivery of high-confidence, high-relevance forecasts of convection across the continental United States and adjacent coastal waters,” according to information available on the Aviation Weather Center (AWC) at aviationweather.gov. The forecasts will allow air traffic management decision makers to “proactively and collaboratively initiate, amend or terminate planned or active traffic flow management initiatives, resulting in safe and efficient use of the National Airspace System (NAS).”
The TCF was developed to support those involved with “convective weather mitigation strategies,” including decision makers at the U.S. Federal Aviation Administration (FAA) Air Traffic Control System Command Center, FAA Air Route Traffic Control Center Traffic Management Units, and airline and corporate flight operations centers.
The TCF is a graphical representation of “high confidence” forecast convection for the contiguous 48 states and adjacent coastal waters. Also included is a section of southern Canada from Thunder Bay, Ontario, to Quebec City. The TCF has specific minimum criteria used to define an area of convection that may impact flight operations. The criteria are composite radar reflectivity of at least 40 decibels (dBZ) with echo tops at or above Flight Level (FL) 250 (approximately 25,000 ft) and coverage of at least 25 percent of the designated area. And the forecaster confidence must be at least 50 percent that these three criteria will be met.
If appropriate, the forecast may include a line of convection (a squall line). For classification as a line, the area must be a line of convective cells with a composite radar reflectivity of at least 40 dBZ, having a length of at least 100 nm (185 km), linear coverage of 40 percent or greater and echo tops at or above FL 250. Again, forecaster confidence that this will occur must be 50 percent or higher. Reflectivity images paint a picture of the weather from the energy reflected back to the weather radar. According to the NWS, a value of 20 dBZ is typically the point at which light rain begins. As dBZ values increase, so does the intensity of the rainfall.
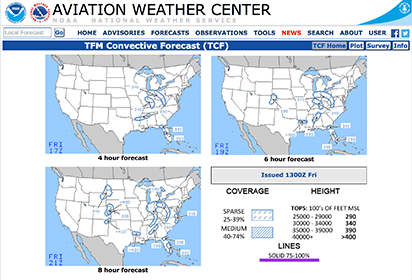
The actual product consists of the convective forecast for four, six and eight hours, superimposed on a map of the lower 48 states, adjacent waters and southern Canada. Areas where convection is expected are encompassed within a blue polygon. Predicted convective coverage within the area (categorized as sparse with coverage of 25 to 39 percent, or medium with coverage of 40 to 74 percent) will be noted. Highest expected cloud tops will also be noted and categorized by 10,000–ft above mean sea level (AMSL) increments up to 40,000 ft AMSL. If convective line formation is expected, it will be depicted and active convection coverage within the line will also be noted. The forecasts are updated every two hours, seven days a week. Archived TCF images are also available.
The NWS had produced a CCFP since 1999. In 2014, the FAA’s Collaborative Decision Making Weather Evaluation Team wanted to improve the convective forecasts. The team believed that automating the CCFP would “free up” forecasters to concentrate on specific significant events. So in the spring of 2015, the Aviation Weather Center began a test run of two products, an automated version of the CCFP, which continued to run continuously, and an event–driven product, the Collaborative Aviation Weather Statement (CAWS). The CAWS consisted of both graphics and text with considerable human input and was only produced when a situation developed in which the CCFP forecast was considered to be suspect.
 After a two-season test run, it was determined that the CAWS was “neither effective nor ineffective in supporting strategic planning and traffic flow management decision making during convective weather.” Rather, there was some confusion with two products verifying for the same time period but sometimes giving different results. For the start of the 2017 convective season, it was decided to drop the CAWS and continue with the CCFP with some modifications, specifically adding human input. Meteorologists were able to examine computer-generated forecasts and make any adjustments they deemed necessary. The name of the product was changed to the TCF to reflect these differences with the old CCFP and to move on from a less than successful experiment. The current forecast can be found at the AWC site.
Graphical Forecasts
For years, pilots relied on the standard area forecast (FA) to give them en route forecast weather information. This text product, manually generated by aviation meteorologists, was much more general than the airport-specific terminal aerodome forecast (TAF) but covered a much larger area (a number of states). FAs are issued three times a day from the Aviation Weather Center. Six areas cover the lower 48 states as well as the Gulf of Mexico and the Caribbean. Alaska and Hawaii produce their own FAs. The forecast is for 12 hours, plus a six-hour outlook. The product includes a brief synopsis of the weather situation (fronts, highs and lows, etc.) and a general forecast of clouds and weather that may affect flight operations. Pilots also are advised to check SIGMETs (significant meteorological information) and AIRMETs (airmen’s meteorological information) for more significant weather hazards.
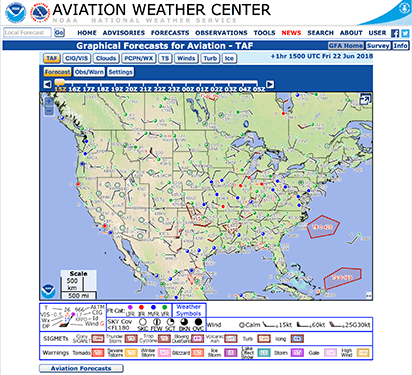
In May 2015, the FAA formally requested that the NWS develop a new product to replace the FA. Utilizing advances in computer technology, the new product would provide similar and even more accurate information in digital and graphic formats. To meet the request, the NWS developed the GFA, an interactive tool that allows users to easily access a wide variety of pertinent weather information. After a period of testing, the GFA became operational in spring 2017.
The GFA is not a weather product itself. Rather, it is an automated display of other weather products depicting both current and forecast conditions. The goal was to make these products more readily accessible and display them in a way that made their information easier to digest. The GFA covers the contiguous United States from the surface to FL 480 (approximately 48,000 ft).The interactive map feature allows a user to “zero in” on an area of concern. Current observation data includes METARS (aviation routine weather reports), PIREPS (pilot reports), and information obtained from radar and satellites. A special feature allows users to access hourly data going back 14 hours so trends can be discerned. Forecast data is available on an hourly basis out to 15 hours and includes TAFs, ceiling and visibility, clouds and precipitation, and thunderstorms. Wind, icing and turbulence forecasts are available at various flight levels.
 As was the case with the CCFP changes, the goals of the GFA were to transition to “more modern digital and graphical forecasts” and “to focus the efforts of forecasters on maximizing operational benefit to aviation end users, resulting in improved weather information to decision makers.” The GFA is a “one stop” resource for aviation weather information. Much of the information provided is automated. The home page for the GFA can be found on the AWC website. In addition to the operational GFA, users also can access a full description of the product and a video tutorial on how to use it.
Edward Brotak, Ph.D., retired in 2007 after 25 years as a professor and program director in the Department of Atmospheric Sciences at the University of North Carolina, Asheville.
Reference Material
- Graphical Forecasts for Aviation Overview
- Product Description Document Graphical Forecasts for Aviation
- Traffic Flow Management (TFM) Convective Forecast (TCF) Overview
- Product Description, Product: Traffic Flow Management (TFM) Convective Forecast (TCF)
All images: U.S. National Weather Service


