In an industry that is cost-focused and competitive, one facet of aviation should not be weaponized as a competitive business strategy: best practices for enhancing safety.
Our industry views safety within the context of managing risk to acceptable levels.1 Thus far, we have done an excellent job of identifying and mitigating the risks that are easily measurable (for example, the number of altitude violations, unstable approaches, engine failures). While the commitment and dedication thus far have been commendable, when considering our collective responsibility in managing safety risks, shouldn’t we also feel that it’s important to contemplate a way to measure compliance with standard operating procedures (SOPs) on a large scale? After all, SOP compliance, or any lack thereof, contributes to or degrades safety. Measuring large-scale SOP compliance is important, as is analyzing how we’re quantifying safety culture. For these reasons, it is important to ask: Are we analyzing and quantifying safety culture as effectively as we might?
Many facets of an organization’s culture can be measured through employee behavior. Yet most airline organizations are not quantifying employee behavior on a macro level, instead focusing on micro-level patterns and trends to identify and mitigate risk. In this paper, we argue for the relevancy of quantifying employee behavior as a necessary risk-mitigation tool as required by safety management systems (SMS) — and we explain how it can be done simply.
The crux of our argument lies in the recognition that employee behavior harbors actions that can remain unidentified and, consequently, unquantified, and, therefore, unmitigated. This gap in quantification leads to risks being unrecognized and unassessed, which then poses a significant challenge for effective risk mitigation. To minimize risk to its lowest acceptable level, the airline industry must embrace a more comprehensively analytical approach to quantifying these hidden aspects of employee behavior. Only through such detailed analysis can the subtleties of risk be fully understood and adequately addressed.
Overlooked Recommendation
Nearly two decades ago, the U.S. Federal Aviation Administration (FAA) advised the industry to “measure and track the organization’s corporate culture as it is reflected in attitudes and norms” of employees. This raises pivotal questions for us as industry stakeholders: Has our industry fully embraced this directive? Have we reflected sufficiently on the methodologies used to measure, track, and quantify employee attitudes and norms? Have we fully integrated measurement and analysis of employee behavior as a fundamental component of our SMS? Perhaps some would answer “yes,” to some extent. However, can we really say that the level of integration and optimization meets or exceeds the level of expectation set forth by industry regulators?
Safety managers often gauge the effectiveness of an SMS by quantifying employee engagement in safety reporting programs. Safety analysts then take further steps by analyzing safety reports and looking for novel trends. For example, they look for trends that are deviations from the norm, such as an increase in the frequency of safety reports over a given timeframe. A safety analyst may simply observe an increase in the number of specific reports, or note that most reports originate predominantly from certain departments, or from more tenured employees. These specific insights offer an understanding of broader employee behavior and, to an extent, shed some light on the organization’s safety culture. However, by their nature, they are merely preliminary insights.
This approach does not fully leverage all available data resources. Nor does it harness the potential of in-depth statistical analysis, which is a central point we advocate in this paper. A more comprehensive use of statistical tools could provide deeper, more meaningful insights into employee behavior, culture, and engagement. By moving beyond surface-level trend analysis, we can significantly enhance our understanding of safety culture and its impact on overall risk management in the aviation industry.
Evolving Practices
Some air disasters are familiar to us because their stories have been integrated into our human factors training and because they spurred the implementation of new regulations. Although these events offer crucial risk management information, we recognize them as exceptions from the norm due to their rarity. Categorically speaking, they are classified as outliers. Currently, when discussing risk mitigation, our industry overemphasizes the outliers and does not discuss the everyday behaviors of the many.
The overemphasis on analysis of outliers is further reinforced by the widespread use of outlier detection systems. These systems, some of which employ advanced artificial intelligence algorithms, are crucial in identifying these rare events, but they have inherent limitations. They are designed to flag events that occur infrequently and may not accurately represent the overarching behavioral or cultural norms of an organization. The rarity of the events flagged by these systems should not be undervalued, yet assigning them excessive significance can be problematic. This often leads to a misplacement of focus, overshadowing the more pervasive, yet less conspicuous, behavioral risks within the group. These less conspicuous risks, crucial to our understanding of safety and compliance, are not being quantified with the necessary depth and rigor.
Our proposed new perspective on risk management also extends to the widespread use of risk matrices. These tools, which attempt to simplify complex risk information into an easy-to-understand, structured format, are popular in corporate settings and prevalent in the aviation industry. However, while they offer a quick method for evaluating risk, they are generally recognized to be limited due to their inherent subjectivity and large-scale biases. These limitations should render risk matrices insufficient as the primary tool used in a flight department’s risk management process. Research underscores these limitations.2 For these reasons, we should consider this type of risk management haphazard. Safe operations in the aviation industry call for non-nuanced and unbiased risk management. This proposal highlights our belief that the existing use of risk matrices and subjective assessments influence our industry’s approach to risk evaluation, and for that reason, we demonstrate the need for a more objective method.
Utilizing FOQA Data for Behavioral Insights
Our proposal is to use flight operational quality assurance (FOQA) data to gain a more meaningful understanding of pilot behavior while aiming to enhance safety culture and ensure the highest level of compliance. This approach emphasizes the pivotal role of management in fostering a culture in which SOPs are not just guidelines but expected behavioral norms. When deviations from SOP compliance become more frequent, an organization’s risk level strays from its accepted norms. Utilizing statistical models to represent these shared behaviors allows for quantitative evaluation of training effectiveness, new risk assessment capabilities, and the impact of leadership on the promotion of compliant behavior. Statistical models and methods can be used to choose an appropriate method or action in the face of uncertainty.3
One of our proposed methods differs in two key ways from simply utilizing traditional risk matrices. First, it uses a mathematical approach for risk mapping and risk assessment, thereby reducing human bias. Secondly, unlike risk matrices, which subjectively estimate likelihood, our method quantitatively measures event frequency, enabling a more objective prediction of risk. This shift from subjective estimates to mathematical analysis could mark a significant advancement for our industry. Additionally, our method diverges from typical anomaly-detection methods by analyzing a broad spectrum of events, providing a comprehensive macro-level risk understanding.
Guidelines in FAA Advisory Circular (AC) 120-82, Flight Operational Quality Assurance, underscore the importance of statistical analysis in data interpretation. They also point out that solely focusing on instances in which flight parameters are exceeded does not fully capture or track the extent of compliance with regulations, suggesting that this approach has a limited ability to reflect overall compliant behaviors in aviation operations.
This paper outlines a strategic plan for commercial aircraft operators to incorporate statistical or probabilistic safety analyses into their systems. It not only aligns with FAA guidelines but also paves the way for a more objective, data-driven approach to understanding and molding safety-related behaviors in aviation operations.
The data-driven inferences that this type of analysis could offer are virtually limitless, particularly when assessing adherence to SOPs. In this context, flight data recorders serve as critical repositories, capturing a wide array of actions and outcomes against the backdrop of SOPs’ desired benchmarks.
The heart of such an analysis lies in the construction of a normal distribution, crafted from a robust dataset of continuous data. This continuous data, characterized by measurements that may not be specifically defined but are confined within a certain range of normalcy, forms the cornerstone of this approach. It empowers risk analysts to not only explore but also quantify the likelihood of various outcomes occurring within predefined value ranges. Such a methodical approach paves the way for a comprehensive and clear understanding of safety risks. This approach is not designed to identify individual pilot behavior but to analyze the culture of SOP compliance, scientifically examining the systemic factors and organizational practices that shape safety overall.
Strategic Framework
We begin with utilizing artificial data to understand the presence of outliers and the power of statistical data analytics.
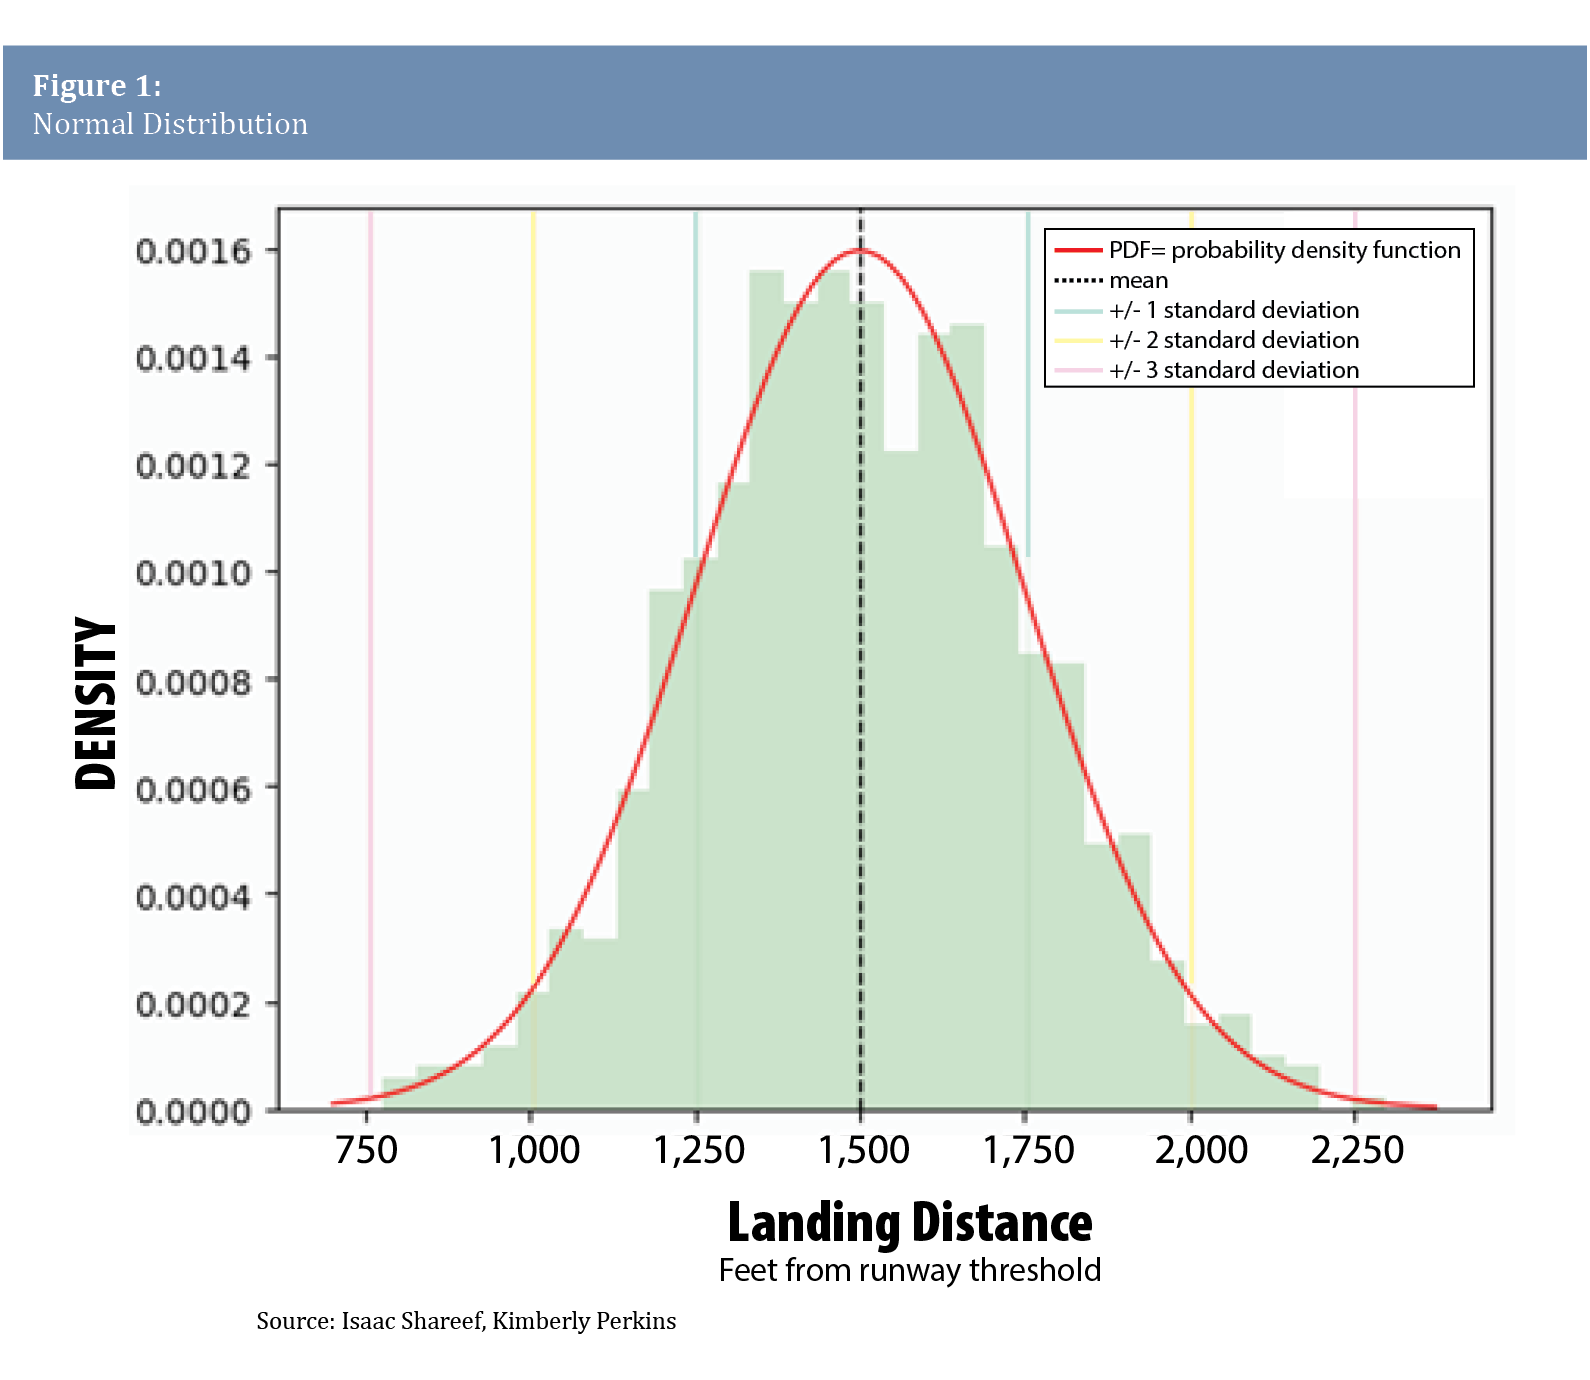
An aircraft flight manual (AFM) may specify an expected landing distance of 1,500 ft (457 m) from the approach end of the runway. If commercial pilots strictly follow SOPs per this example, a normally distributed statistical model of landings will suggest that approximately 68 percent of these landings will fall within a range of 1,500 ft, plus or minus a couple of hundred feet. As shown in Figure 1, the average landing distance is expected to be close to the SOP’s target (1,500 ft), and the standard deviation, which quantitatively delineates the dispersion of landing distances from the mean, offers a statistical measure that encapsulates the extent of deviation expected under normal operational conditions.

To better understand how the probability density function (PDF)4 and probability distribution can help assess risk, we must also understand that outliers are a normally occurring feature in a statistical model. For this example, outliers are categorized as those landings that occur at a distance greater than two standard deviations (in this case approximately 500 ft) from the mean, or SOP expectation, of 1,500 ft. We are essentially labeling a landing that occurs at less than 1,000 ft as an outlier. Furthermore, after first constructing a benchmark distribution (green histogram), we then seek to determine the probability of occurrence of outlier landings. Our benchmark distribution is composed of a total of 3,000 simulated landings, and the histogram is constructed utilizing 50-ft intervals (bins). The interval from 950 to 1,000 ft represents the specific range where we want to understand the probability (or likelihood) of outliers occurring. When calculating the probability of these outliers occurring, we arrive at a likelihood of approximately 1.1 percent. From this, we can deduce that in a normally distributed set of landing data (3,000 trials), we might expect that approximately 33 landings of 3,000 will fall into the outlier category.
When addressing these outliers in safety management, it is important to recognize that these 33 instances are identified as outliers, but they also are, in fact, expected outcomes. This assertion is based on the premise that a statistical analysis of critical safety procedures — such as landings — will follow a normal distribution, as illustrated in the histogram diagram in Figure 1. A characteristic of normal distribution is the inevitable presence of outliers. In simple terms, relevant to a population of pilots, even among a group of skilled pilots, variations in landing outcomes occur naturally: Some landings will be short of the SOP, most will align closely with the SOP, and others will be outside the SOP outcome. Inevitably, some landings will be outliers.
The value of statistical analyses like this one becomes more evident in specific scenarios, such as when an airline operates at small airports with very short runways. In cases like this, prior to commencing operations, the safety team must weigh the significance of outlier events while conducting a comprehensive statistical risk analysis. This type of analysis is crucial as it allows for mathematically understanding the likelihood of events that carry greater risks, such as runway overruns, or landings that are well short of the target. Furthermore, when a commercial aircraft operator initially assesses the risks of operating at airports with very short runways, employing statistical risk models — as opposed to risk matrices — enables a more objective, mathematically grounded evaluation of potential risks in future operations, while avoiding the subjective biases inherent in risk matrices.
Strategic Framework Expanded
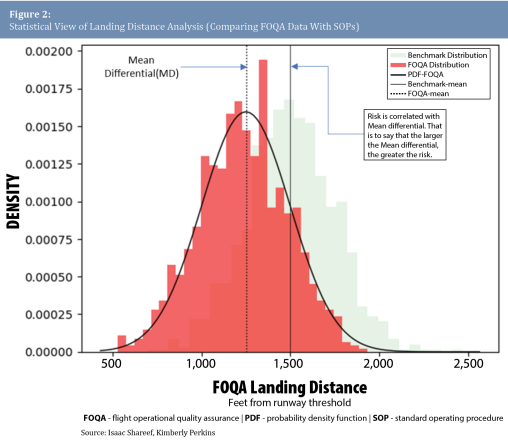
To grasp the wider implications of behavioral risk in aviation, particularly in landing operations, it is crucial to understand how FOQA data distributions and probability density functions can signal deviations from SOPs. Consider a scenario where the benchmark (green) model establishes the expectation according to SOPs. Subsequently, if comparing this benchmark to a model built from recent FOQA data indicates a significant shift in this mean value – say, from an expected mean value of 1,500 ft to 1,250 ft — this is a clear indication that landings are not in alignment with SOP expected outcomes (Figure 2).
By utilizing our proposed framework, which complies with FAA regulations, the FOQA platform becomes an essential component for statistically analyzing risk. As the FAA says, “The value of … FOQA programs is the early identification of adverse safety trends that, if uncorrected, could lead to accidents.” In commercial air carrier flight operations, FOQA data is already being gathered, yet we’re not quite maximizing its benefits without using statistical risk models.
The core of our benchmarking approach is based on the belief that the outcome of pilot behavior follows a pattern resembling a normal distribution. This theory forms the bedrock of our assumption that the behaviors of pilots are comprehensively reflected in FOQA data. Every aspect of aircraft operation — from landings to the subtlest yoke adjustments — is assumed and expected to align with SOPs. Deviations from this expectation should prompt risk managers to ask the critical question: “Why?” Unraveling the “why” is key to identifying potential operational risks.
Isaac Shareef is a Boeing 737 captain, flight line training manager, and line check pilot with extensive experience in commercial and military aviation. He also has expertise in data science, machine learning, and artificial intelligence, applying these technologies to the advancement of flight training and operational safety. Kimberly Perkins is a Boeing 787 airline pilot and doctoral candidate at the University of Washington. Her research focuses on optimized risk mitigation in sociotechnical systems.
Image: Nieuwland Photography | shutterstock
Notes
- ICAO’s Doc 9859, Safety Management Manual (SMM), Third edition defines safety as “the state in which the possibility of harm to persons or of property damage is reduced to, and maintained at or below, an acceptable level through a continuing process of hazard identification and safety risk management.”
- In his 2008 essay, “What’s Wrong With Risk Matrices?” (see Risk Analysis: An Official Publication of the Society for Risk Analysis Volume 28 (April 2008): 497-512), Louis Anthony Cox suggests that “different users may obtain opposite ratings of the same quantitative risks.” Similarly, in “Recommendations on the Use and Design of Risk Matrices” (Safety Science Volume 76 (July 2015): 21–31. https://doi.org/10.1016/j.ssci.2015.02.014), Nijs Jan Duijm says, “[A]ny risk assessment not based on a purely statistical basis and mathematical consequence assessment requires subjective assessments to be made.”
- Niewiadomska-Bugaj, M.; Bartoszyński, R. Probability and Statistical Inference (Third edition). Wiley-Interscience. (2020). https://doi.org/10.1002/9781119243830
-
A probability density function (PDF) is a mathematical function that describes the relative likelihood a continuous random variable takes on a given value. Though often visualized as a bell curve for normal distributions, PDFs can take various shapes, depending on the distribution of the variable. In the context of this paper, the PDF facilitates the computation of the probability that a particular event, such as a landing, occurs within a specified range of distances.


