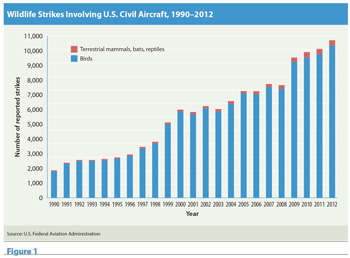
The number of reported wildlife strikes involving civil aircraft increased nearly six-fold between 1990 and 2012, with a record 10,726 strikes in 2012 (Figure 1), according to a report prepared for the U.S. Federal Aviation Administration (FAA).1 Over the 23-year period, the number of reported strikes — of birds, terrestrial mammals, bats and reptiles — totaled 131,096, the report said.
Commercial air carrier aircraft accounted for 87,670 (67 percent) of total strikes and 6,246 (58 percent) of those recorded in 2012, the report said. In comparison, the 1990 data showed that the 1,354 commercial aircraft strikes accounted for 73 percent of the total. The rate of strikes for commercial air carriers rose from 15.14 per 100,000 aircraft movements in 2000 to 25.12 in 2012.
Despite the overall increase in the period’s reported strikes, the number of damaging strikes was lower in 2012, when 606 such strikes were reported, than it was in 2000, when the figure reached a peak of 764 (Figure 2), the report said. The decline has been most pronounced for commercial aircraft in the airport environment — at or below 500 ft above ground level (AGL), the report said (Figure 3). In that category, damaging strikes totaled 228 in 2012, down from 353 in 2000.
Data showed no decline in damaging strikes involving commercial aircraft above 500 ft AGL or general aviation aircraft. In fact, the number of damaging wildlife strikes involving commercial aircraft above 500 ft AGL increased slightly to 151 in 2012, up from 142 in 2000.
Overall, data show a total of 381 damaging wildlife strikes involving commercial aircraft in 2012, down 25 percent from the record 510 reported in 2000. The rate of damaging strikes to commercial aircraft over the same period declined 12 percent, from 1.73 per 100,000 aircraft movements in 2000 to 1.53 in 2012, the report said.
“These declines in damaging strikes for commercial aviation in the airport environment have occurred in spite of an increase in populations of hazardous wildlife species and demonstrate progress in wildlife hazard management programs” at airports certificated under U.S. Federal Aviation Regulations Part 139 to handle air carrier operations with aircraft that can seat more than nine people, the report said.
The population increase in those hazardous wildlife species is one factor that is cited in explaining the increased number of wildlife strikes. For example, the resident (non-migratory) population of Canada geese in the United States and Canada increased to 3.8 million in 2012, up from 500,000 in 1980, the report said.
As populations of those species have increased, so has air traffic, with commercial air traffic in the United States growing from 18 million aircraft movements in 1980 to 23 million in 1990 and up to 29 million movements in each year that followed. Over the years, many air carriers have retired airplanes with older, noisier engines and replaced them with quieter two-engine airplanes that are more difficult for birds to detect and avoid.
These factors mean that wildlife strikes are likely to continue increasing over the next decade, the report said.
Strikes were reported at 1,771 U.S. airports over the 23-year period, including 531 Part 139 certificated airports and 1,240 general aviation airports; strikes involving U.S.-registered aircraft also were reported at 273 non-U.S. airports, the report said (Figure 4). In 2012, strikes were reported at 643 airports, compared with 332 in 1990.
The report said that in 2012, all Part 139 airports had either completed a wildlife hazard assessment, were completing an assessment or had taken a federal grant to conduct one. The report credited risk-mitigation efforts at many of these airports with contributing to the general decline in damaging strikes since 2000, despite increasing populations of many large bird species.
The report said that the National Wildlife Research Center, operated by the FAA and U.S. Department of Agriculture’s Animal and Plant Health Inspection Service (APHIS), has focused its recent strike-prevention research in several areas, including evaluating avian radar systems.
“The assessment effort is part of the FAA’s overall investigation into the effectiveness of commercially available avian radar detection systems at U.S. civil airports when used in conjunction with other known wildlife management and control techniques,” the report said. “Though it is well established that radar can detect wild birds, there is little published information concerning the accuracy and detection capabilities related to range, altitude, target size and effects of weather for avian radar systems” (ASW, 3/09).
Other research has examined the likely effects of limiting the access of birds and other wildlife to storm water ponds and other attractive areas on and near airports, developing and using new technologies to harass and deter hazardous species and using pulsating lights mounted on aircraft to enhance wildlife deterrence.
Although many airports have taken steps to mitigate wildlife strike risks, little has been done to reduce the number of wildlife strikes outside airport boundaries, the report said, recommending enhanced wildlife management efforts aimed at areas within 5 nm (9 km) of airports.
Over the entire reporting period, 482 species of birds were involved in 97 percent of the reported wildlife strikes, the report said; the most damaging strikes have been associated with waterfowl, gulls and raptors. Forty-two species of terrestrial mammals accounted for 2.2 percent of wildlife strikes, with deer and related species linked to the most damaging strikes. In addition, 15 species of bats were involved in 0.6 percent of strikes, and 11 species of reptiles in 0.1 percent.
Data showed that 52 percent of bird strikes occurred between July and October, and 30 percent of deer strikes occurred in October and November. Bird strikes were more frequent during the day (62 percent), and strikes involving terrestrial mammals were more likely at night. Both birds (60 percent) and terrestrial mammals (64 percent) were most likely to be struck during landing. Thirty-seven percent of bird strikes and 34 percent of terrestrial mammal strikes were reported during takeoff and climb.
The report assigned a “hazard level” to each of the 86 species of birds and 10 species of terrestrial mammals that had figured in at least 50 strikes, calculating scores based on the percent of strikes that caused damage; major damage; and/or a negative effect on flight, which most often involved a precautionary or emergency landing, as noted in 4 percent of wildlife strike reports.2 At the top of the list of most hazardous species were snow geese, followed by black vultures, turkey vultures, northern pintails and Canada geese.
The number of strikes decreased dramatically with altitude, with 72 percent of all strikes involving commercial aircraft occurring at or below 500 ft. Above that altitude, data showed that the number of strikes involving commercial aircraft decreased 34 percent with every 1,000 ft increase in height.
Since 1990, the report said, aircraft have been destroyed in 60 wildlife strikes. On average, strikes have cost the U.S. civil aviation industry $957 million and 583,175 hours of aircraft down time annually, the report estimated.
Worldwide, since 1988, 250 people have been killed and more than 229 aircraft have been destroyed in wildlife strikes, including a September 2012 accident in which a Dornier 228-200 crashed after being struck by a vulture during a takeoff in Nepal, killing 19 people.
In recent years, the FAA has developed programs intended to make it easier to report a wildlife strike online or using mobile devices. Information is available at <www.faa.gov/mobile/> and <wildlife.faa.gov>.
Notes
- Dolbeer, Richard A.; Wright, Sandra E.; Weller, John; Begier, Michael J. Wildlife Strikes to Civil Aircraft in the United States, 1990–2012. Report prepared by the FAA and the Wildlife Services agency of USDA’s APHIS. FAA National Wildlife Strike Database Serial Report Number 19. September 2013.
- The report said that the precautionary or emergency landings included 45 instances of jettisoning fuel, 46 instances of circling to deplete fuel or conducting an overweight landing. Rejected takeoffs were the second-most frequent negative effect; rejected takeoffs occurred in 2 percent of the reported strikes.


