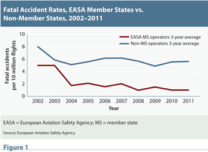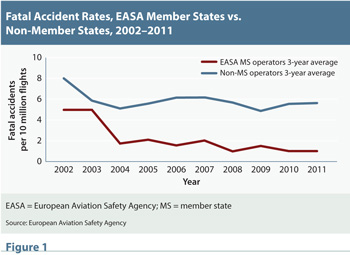
The fatal accident rate for scheduled passenger and cargo flights among the 31 European Aviation Safety Agency (EASA) member states (MS) improved in the latest 10-year survey, and in 2011 the fatal accident rate was 0.96 per 10 million flights.1,2
For the decade 2002–2011, there were 1.6 fatal accidents per 10 million flights, the same rate as for North America. As recently as the 2001–2010 period, the EASA MS rate had been 3.3. That was influenced by the exceptionally high rate of 11.7 in 2001. EASA member states are the 27 European Union states plus Iceland, Liechtenstein, Norway and Switzerland.
One fatal accident occurred in EASA MS commercial air transport airplanes in 2011, with six on-board fatalities.3 There were no fatal accidents in the category in 2010. For the 2000–2009 decade, fatal accidents averaged four per year. The number of fatal accidents was as high as five in both 2005 and 2006.
The reduction in the number of fatal accidents does not just reflect fewer flights. The traffic level in 2011 was similar to the one of 2006, the report says. EASA MS had 32 accidents in 2011, versus 28 in the previous year and an average of 30 for 2000–2009.
The trend, based on a three-year moving average, has improved in the most recent 10-year period. The higher rate of non-MS fatal accidents, which in 2002 and 2003 appeared to be converging with that of EASA MS, has maintained a wide gap since.4
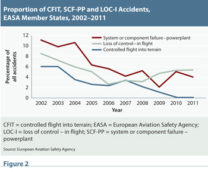
Fatal and non-fatal accidents involving EASA MS–operated airplanes were assigned to categories based on the standardized definitions of the Commercial Aviation Safety Team-International Civil Aviation Organization (CAST-ICAO) Common Taxonomy Team (CICTT). Controlled flight into terrain (CFIT) accidents declined as a percentage of all accidents in the 2002–2011 period. “This can be attributed to technological improvements and to increased awareness of situations which may lead to such accidents,” the report says.
Similarly, accidents that involve the failure of a system or component related to the engine (SCF-PP) have decreased as a percentage of all accidents.
Since reaching a low point in 2006, loss of control–in flight (LOC-I) accidents have risen as a percentage of total accidents, and now exceed SCF-PP and CFIT.
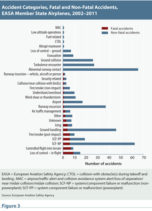
Post-impact fire and smoke, and failure of a system or component not related to the engine, were also among leading categories of fatal accidents. Abnormal runway contact was the category involved in the largest number of accidents, none of them fatal.
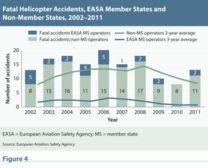
Like airplane fatal accidents, helicopter fatal accidents involving EASA MS operators increased year-over-year. There were two such accidents in 2011, compared with none in 2010 and an average of three per year in 2000–2009. In non-MS operations, the number increased from eight each in 2009 and 2010 to 11 in 2011 — still better than the average of 13.6 from 2002–2008.
Total EASA MS helicopter accidents also increased, from two in 2010 to six in 2011, averaging eight per year in 2000–2009.
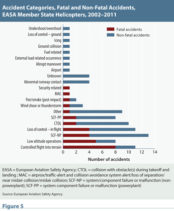
In contrast with airplanes, CFIT figured prominently in EASA MS helicopter accidents — particularly fatal accidents in 2002 through 2011. Low altitude operations–related accidents (LALT) had the second-highest number of fatal accidents. The report said, “This occurrence category includes accidents which occur while the aircraft is flown intentionally at low altitude, excluding the phases of take-off and landing.”
The largest number of accidents, comprising both fatal and non-fatal accidents, were categorized as SCF-NP, system/component failure or malfunction not related to the engine. That included accidents related to gearbox malfunction, the report says.
Another conspicuous category in helicopter accidents was CTOL, or collision with obstacles during takeoff and landing. The report said that referred to main or tail rotor collisions with objects on the ground.
The annual safety review includes, for the second year, a chapter on air traffic management (ATM). “The sources of the data, as well as the occurrence category definitions, differ from those of other chapters,” the report says. “Instead of CICTT categories, in similar figures of this report, this chapter uses occurrence categories developed specifically for ATM since 2000.”5
In 2011, the largest number of ATM-related accidents was in the category of GCOL, or collision with aircraft moving on the ground and a vehicle, person or obstruction. It also was the most common category for the years 2005–2011, except for “other.”
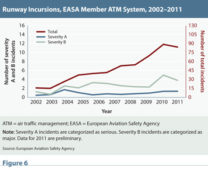
The overall number of runway incursions reported has increased during 2002–2011 (Figure 6). “The rate of serious incidents (severity A) is, in 2011, at the same level as the previous year after it showed a slight increase over time,” the report says. “The rate of major incidents (severity B) decreased until 2009, but the data for 2010 showed a considerable increase. However, preliminary 2011 data indicate a possible reverse, although at a higher level than 2009.”
Notes
- EASA. Annual Safety Review 2011. <bit.ly/N2JIDr>.
- Accident and statistical information was provided to EASA by the International Civil Aviation Organization.
- Accidents in this category involved aircraft with a certificated takeoff weight over 2,250 kg (4,960 lb).
- As the alternative to EASA MS operators, the report uses the term “third country operators,” which apparently includes operators in other regions worldwide. We have adopted the term “non-MS” in preference to “third country” for clarity.
- The ATM chapter data are sourced from the Eurocontrol Annual Summary Template reporting system. Data for 2011 are preliminary.
