
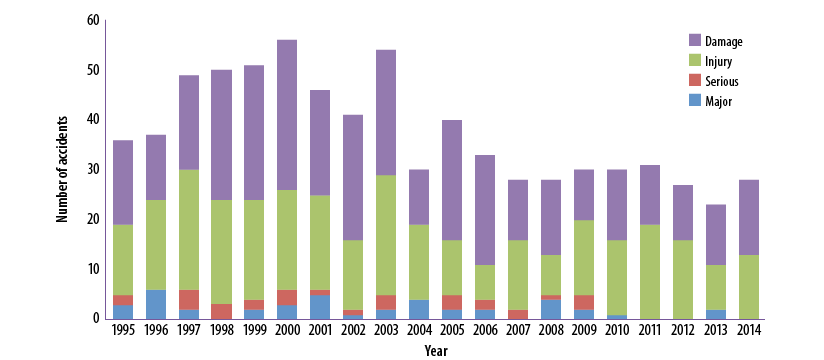
U.S. Federal Aviation Regulations Part 121 carriers did not suffer any major or serious accidents in 2014, according to preliminary data released in early August by the National Transportation Safety Board (NTSB). Last year represents the third year in the past four that U.S. Part 121 airlines have not suffered any major accidents and the fifth year in a row without any serious accidents, according to NTSB data. There were, however, 13 Part 121 accidents with injury in 2014 and 15 accidents with damage (Figure 1).
Figure 1 — U.S. Part 121 Carrier Accidents, 1995–2014
Source: U.S. National Transportation Safety Board
NTSB defines a major accident as one in which any of three conditions is met: A Part 121 aircraft was destroyed, or there were multiple fatalities, or there was one fatality and the Part 121 aircraft was substantially damaged. A serious accident is one in which at least one of two conditions is met: There was one fatality without substantial damage to a Part 121 aircraft, or there was at least one serious injury and substantial damage to a Part 121 aircraft. An injury accident is a nonfatal accident with at least one serious injury and without substantial damage to a Part 121 aircraft; and a damage accident is an accident in which no person was killed or seriously injured, but in which an aircraft was substantially damaged.
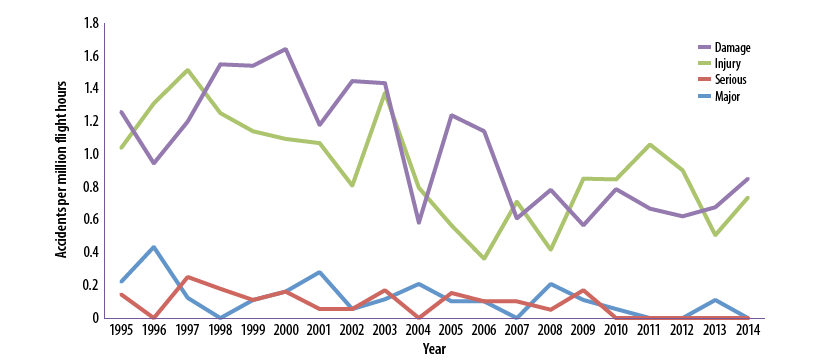
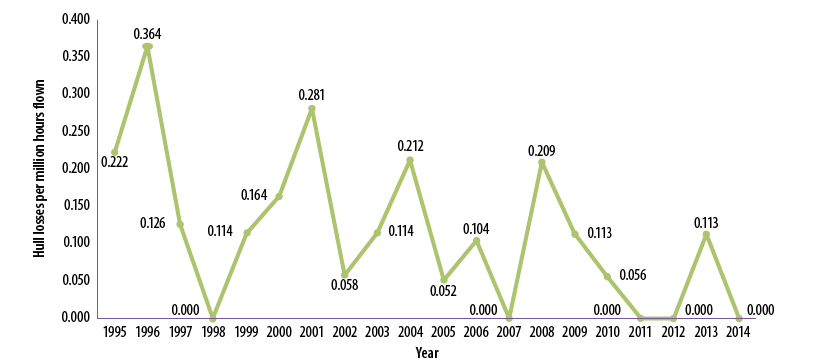
Based on just under 17.6 million aircraft hours flown in 2014, the Part 121 carrier injury accident rate was 0.739 per 1 million hours flown and the damage accident rate was 0.852 per million hours flown (Figure 2). The overall accident rates for Part 121 carriers in 2014 were 0.159 per 100,000 flight hours; 0.0037 per million miles flown; and 0.311 per 100,000 departures, all up slightly from the previous year, when there were 23 Part 121 accidents, including two fatal accidents that resulted in nine deaths. Part 121 carriers did not record any hull losses in 2014, after reporting two in 2013. The worst years for hull losses in the past 20 years were 2001 and 1996, with five in each year (Figure 3). There were two fatal Part 121 accidents in 2013, but none last year.
Figure 2 — U.S. Part 121 Carrier Accident Rates, 1995–2014
Source: U.S. National Transportation Safety Board
Figure 3 — U.S. Part 121 Carrier Hull Loss Rate, 1995–2014
Source: U.S. National Transportation Safety Board
Of the 28 total Part 121 accidents in 2014, 27 occurred during scheduled service and one during nonscheduled service. Scheduled carriers operated 8.89 million departures and 17.23 million flight hours in 2014, compared to 121,000 departures and 373,000 flight hours for nonscheduled services. Flight hours and departures are compiled and estimated by the U.S. Federal Aviation Administration (FAA).
Last year, passenger enplanwements on Part 121 carrier operations increased to 764 million from 746 million in 2013, but for the fifth year in a row, there were no passenger fatalities, according to NTSB data. Part 121 carriers did not record any serious passenger injuries last year, either. The worst years for passenger fatalities in the past 20 years were 2001, when Part 121 carriers recorded 483 passenger fatalities, and 1996, when the passenger fatality total was 319. The most recent year in which there were passenger fatalities was 2009, when 45 passengers were killed when Colgan Air Flight 3407 crashed while on an instrument approach to Buffalo-Niagara International Airport, Buffalo, New York, on Feb. 12, 2009. The crash also killed the four crewmembers (two pilots and two flight attendants) on board and one person on the ground.
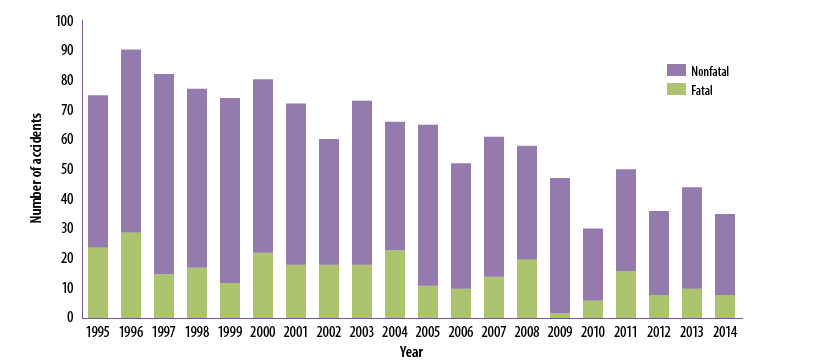
U.S. Part 135 carriers (commuter and on-demand operations, previously referred to as scheduled and nonscheduled services) suffered 39 accidents in 2014, eight of which were fatal accidents in which a total of 20 people were killed. Of the nearly 3.8 million flight hours flown by Part 135 carriers, the vast majority — 3.45 million — were flown by on-demand operations, which encompass charters, air taxis, air tours and medical services when a patient is on board. Thirty-five of the 39 Part 135 accidents and all eight of the fatal accidents last year were attributed to on-demand operations. In 2013, Part 135 on-demand carriers had 44 accidents, 10 of which were fatal accidents (Figure 4). The Part 135 on-demand operations overall accident rate was 1.02 per 100,000 flights hours in 2014, down from a rate of 1.3 in 2013. The on-demand fatal accident rate was 0.23 per 100,000 flight hours in 2014, down from 0.3 the previous year (Figure 5). Flight hours are estimated by FAA, but a flight hour estimate is not available for 2011, so accident rates for 2011 are not calculated.
Figure 4 — U.S. Part 135 On-Demand Accidents, 1995–2014
Source: U.S. National Transportation Safety Board
Figure 5 — U.S. Part 135 On-Demand Carrier Accident Rates , 1995–2014*
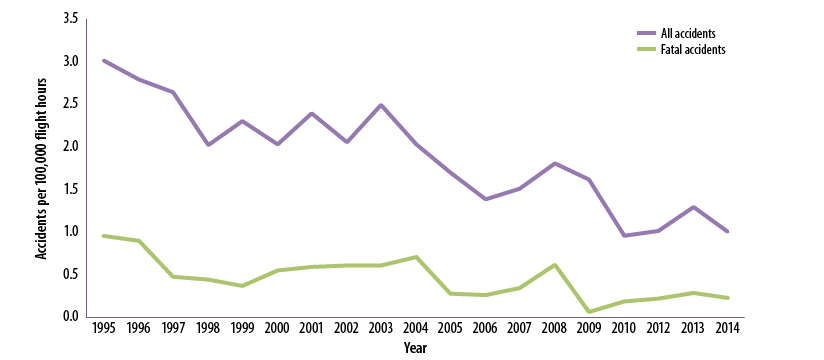
* Flight hour estimates for 2011 currently are not available, so accident rates for that year cannot be calculated. The year 2011 is not reflected above.
Source: U.S. National Transportation Safety Board
Part 135 commuter operations had four accidents in 2014, down from seven in 2014, for an accident rate of 1.15 per 100,000 flight hours, compared with 2.18 per 100,000 flight hours in 2013.
Worldwide Accident Rate
Using data extracted from official accident reports, its own databases and from the International Civil Aviation Organization and Ascend, Airbus analysis showed two fatal commercial air transport accidents worldwide in 2014 and nine hull losses. Assuming an exposure of 28.4 million flights, that translates to a fatal accident rate of 0.07 per million flights and a hull loss rate of 0.32 per million flights, according to the airframe manufacturer’s annual analysis of commercial aviation accidents.1
The scope of the Airbus analysis includes all Western-built commercial air transport jets above 40 seats. Non-Western-built jets are excluded due to lack of information. Also excluded from the data are non-revenue flights. At the time the analysis was published, Airbus did not include Malaysia Airlines Flight 370 (MH370) among the fatal accidents because with the information available, it could not be determined whether the event fit into the scope considered for its accident statistics. The manufacturer said, “Sabotage, military actions, terrorism, suicide and the like are excluded from the accidents we consider in order to remain focused on safety risks.” MH370, a Boeing 777-200ER, disappeared on March 8, 2014, on a scheduled flight from Kuala Lumpur, Malaysia, to Beijing with 239 passengers and crew onboard.
Over the past 20 years, 31 percent of all fatal accidents have occurred during the approach phase of flight and 16 percent during the landing phase. Airbus defines the approach phase as starting when the crew initiates changes in the aircraft’s configuration and/or speed in view of the landing. Approach normally ends when the aircraft is in the landing configuration and the crew is dedicated to land on a particular runway, but it may end with the initiation of an initial climb or go-around phase. Five percent of the fatal accidents occurred during the go-around phase. The cruise phase accounted for 13 percent of fatal accidents, as did the initial climb phase. The takeoff run phase accounted for 6 percent; initial descent, 5 percent, and parking, taxi and aborted take-off run, 1 percent each.
A fatal accident is an event in which at least one person is fatally or seriously injured as a result of being in the aircraft, or in direct contact with any part of the aircraft, including parts that have become detached from the aircraft, or in direct exposure to jet blast, except when the injuries are from natural causes, self-inflicted or inflicted by other persons, or when the injuries are to stowaways hiding outside the areas normally available to passengers and crew, Airbus said.
During the same 20-year period, 45 percent of all hull loss accidents have occurred during the landing phase of flight and 19 percent during the approach phase. The landing phase begins when the aircraft is in the landing configuration and the crew is dedicated to land on a particular runway, according to Airbus. The phase ends when the aircraft’s speed is decreased to taxi speed. Two percent of the hull loss accidents occurred during the go-around phase. The initial climb phase accounted for 7 percent of hull loss accidents; the take-off run, climb to cruise and cruise phases, accounted for 6 percent each, and the taxi phase accounted for 3 percent. The aborted takeoff, parking and initial descent phases accounted for 2 percent each.
A hull loss is an event in which the aircraft is destroyed or substantially damaged beyond economical repair. The threshold of economical repair decreases with the residual value of the aircraft. So as an aircraft ages, an event that leads to damage that may have been considered economically repairable previously may eventually be considered a hull loss, Airbus said.
General Aviation
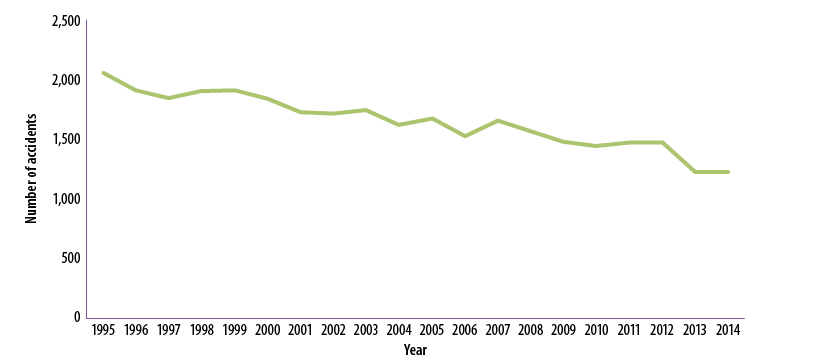
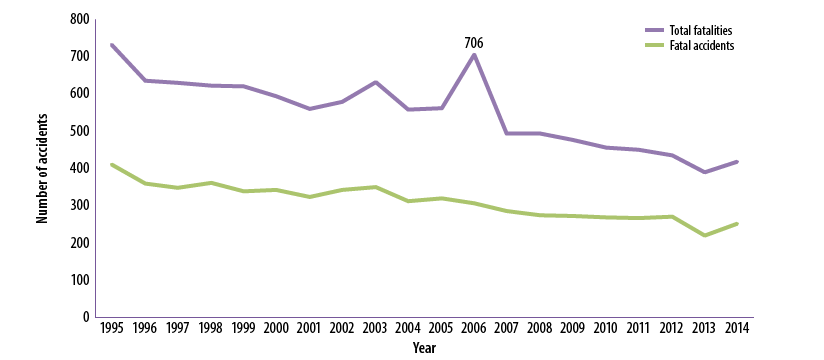
The number of U.S. general aviation (GA) accidents continued a downward trend in 2014, totaling 1,221 for the year, which marks a 20-year low, according to NTSB’s preliminary data (Figure 6). The total includes 23 U.S.-registered aircraft accidents that occurred outside the United States, its territories or possessions. GA fatal accidents increased 14 percent to 253 in 2014 from 222 in 2013, but last year’s total still is the second lowest in the last 20 years, continuing a general downward trend that began picking up steam in 2004. The total number of fatalities suffered in GA accidents increased to 419 last year from 391 in 2013 (Figure 7). Like fatal accidents, fatalities have been on a downward trend for much of the past two decades, with the notable exception of 2006. The 706 total fatalities in 2006 includes the 154 people killed aboard a foreign-registered Boeing 737 operated by Brazil’s GOL Airlines when it collided with a U.S- registered Embraer Legacy 600 business jet over the Amazon jungle.
Figure 6 — U.S. General Aviation Accidents, 1995–2014
Source: U.S. National Transportation Safety Board
Figure 7 — U.S. General Aviation Fatal Accidents and Fatalities, 1995–2014
Source: U.S. National Transportation Safety Board
Reducing GA fatalities is one of FAA’s top priorities, and the agency has a goal to reduce the GA fatal accident rate by 10 percent over the 10-year 2009-to-2018 period. FAA counts more than 220,000 total in the U.S. GA community, including amateur-built aircraft, rotorcraft and balloons. In July, FAA said it is working with industry on a number of initiatives to improve GA safety. One of those is the Fly Safe outreach campaign on loss of control. According to FAA, loss of control–in flight was the leading cause of fatal GA accidents from 2001 through 2013, followed by controlled flight into terrain, system component failure–power plant, low-altitude operations and other.
U.S. GA flight hours have been steadily declining since 2003, likely for economic reasons, and that trend continued in 2014 as flight hours declined about 7.5 percent to 18.1 million from nearly 19.5 million in 2013. According to FAA estimates, U.S. GA flight hours peaked in 1999 at 29.2 million. GA flight hours have declined more than 38 percent since 1999. Flight hour estimates for 2011 are not currently available and the FAA is engaged in recalibration efforts. Both the GA accident and fatal accident rates, turned modestly higher in 2014. The accident rate increased to 6.74 per 100,000 flight hours in 2014 from 6.26 in 2013, and the fatal accident rate increased to 1.40 per 100,000 flight hours.
Overall, U.S. civil aviation suffered 439 fatalities — on board and on the ground — in 2014 (Table 1).
| Accidents | Fatalities | |||
|---|---|---|---|---|
| All | Fatal | Total | Aboard | |
|
Notes: All data are preliminary. Accidents and fatalities in the categories do not necessarily sum to the figures in U.S. civil aviation because of collisions involving aircraft in different categories. U.S. air carriers operating under U.S. Federal Regulations (FARs) Part 135 were previously referred to as “scheduled and nonscheduled services.” Current tables now refer to these same air carriers as “commuter operations and on-demand operations,” respectively, in order to be consistent with definitions in FARs Part 119.3 and terminology used in Part 135.1. On-demand Part 135 operations encompass charters, air taxis, air tours or medical services (when a patient is on board). Source: U.S. National Transportation Safety Board |
||||
| Part 121 scheduled | 27 | 0 | 0 | 0 |
| Part 121 nonscheduled | 1 | 0 | 0 | 0 |
| Part 135 commuter | 4 | 0 | 0 | 0 |
| Part 135 on-demand | 35 | 8 | 20 | 20 |
| U.S. general aviation | 1221 | 253 | 419 | 410 |
| Total U.S. civil aviation | 1287 | 261 | 439 | 430 |
Note
- Airbus. Commercial Aviation Accidents 1958-2014: A Statistical Analysis. May 2015.