The U.S. civil helicopter accident and fatal accident rates both declined sharply in 2014, which the United States Helicopter Safety Team (USHST) says is indicative of stakeholders learning how to better manage risk.
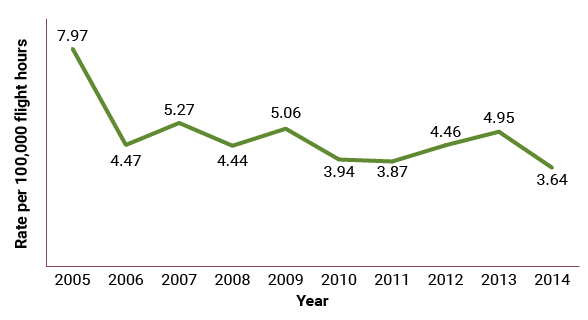
According to figures released in February by the USHST and its parent organization, the International Helicopter Safety Team (IHST), the civil helicopter accident rate was 3.64 accidents per 100,000 flight hours, a decline of 26.4 percent from 2013’s rate of 4.95 accidents1 per 100,000 flight hours (Figure 1). The results from 2014 reversed a two-year increasing trend, which saw the accident rate rise from 3.87 per 100,000 flight hours in 2011 to 4.46 in 2012 and, as noted, 4.95 in 2013.
Figure 1 — U.S. Civil Helicopter Accident Rate, 2005–2014

Source: Source: U.S. Helicopter Safety Team
Leadership from the American Helicopter Society, the Helicopter Association International, manufacturers and other interested organizations, and the U.S. Federal Aviation Administration (FAA) joined together to form IHST in 2005 following the first International Helicopter Safety Symposium. The intent of the organization is to develop and implement a “data-driven, benefit-focused” safety program designed to continuously reduce the risk of helicopter accidents, according to the IHST website <ihst.org>. The USHST comprises U.S. government and industry leaders.
The USHST and the IHST have a goal of reducing the civil helicopter accident rate by 80 percent by 2016. As a baseline, the organizations use the accident rate for the 2001–2005 period, which represents the five years before the IHST’s founding in 2005 and the launching of its safety education efforts. Last year’s civil helicopter accident rate of 3.64 per 100,000 flight hours represents a decrease of 54.3 percent from the 2001–2005 baseline of 7.97 accidents per 100,000 flight hours.2 To achieve the USHST’s 80 percent goal, the accident rate would need to reach 1.59 for 2016.
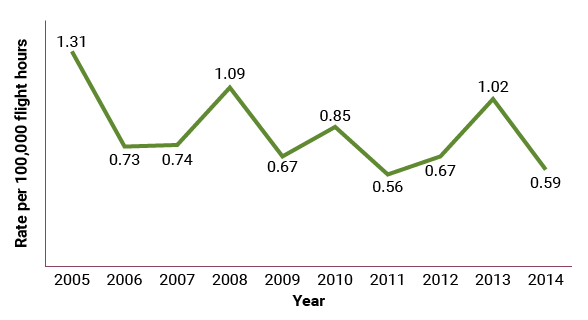
The civil helicopter fatal accident rate declined 42.2 percent in 2014 to 0.59 fatal accidents per 100,000 flight hours from a rate of 1.02 in 2013 (Figure 2). The 2014 fatal accident rate represents a decline of 55 percent from the 2001–2005 baseline rate of 1.31.
Figure 2 — U.S. Helicopter Fatal Accident Rate, 2005–2014

Source: Source: U.S. Helicopter Safety Team
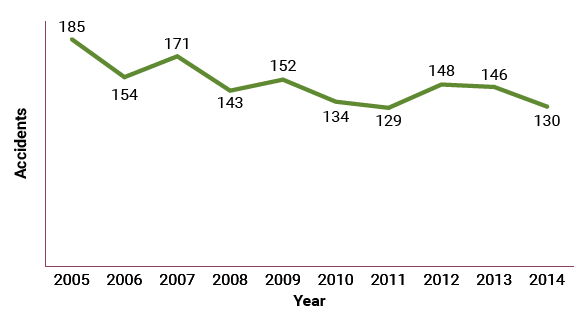
The numbers of civil helicopter accidents and fatal accidents also declined in 2014. Accidents fell 11 percent to 130 for the year, from 146 in 2013 (Figure 3). Despite year-to-year variation, the number of civil helicopter accidents has been on a downward trend since 2005, when there were 185 accidents.
Figure 3 — U.S. Civil Helicopter Accidents, 2005–2014

Source: Source: U.S. Helicopter Safety Team
“One hundred thirty accidents during the year is 130 too many, but we’re glad to see that the numbers are continuing to go down,” said Jim Viola, manager of the FAA’s General Aviation and Commercial Division, who serves as USHST government co-chair. “More helicopter operators, pilots, instructors and mechanics across the country are learning how to better manage risk and are infusing their culture with effective safety habits. Safety messages from the USHST and the IHST are getting through at the grassroots level.”
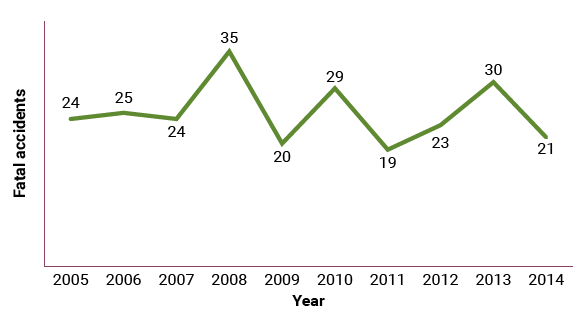
The number of fatal accidents also declined, falling to 21 in 2014, after having spiked to 30 in 2013 from 23 in 2012 (Figure 4). The graph of annual fatal accidents since 2005 does not show the same steady downward trend seen with total accidents over the same period. Prompted by the sharp increase in fatal accidents from 2012 to 2013, the IHST in May 2014 asked stakeholders to “establish an additional focus regarding the steps that can be taken to prevent fatalities in helicopter accidents,” according to an IHST press release.
Figure 4 — U.S. Civil Helicopter Fatal Accidents, 2005–2014

Source: Source: U.S. Helicopter Safety Team
IHST said its statistics show that the most common occurrences leading to fatalities are loss of control, obstacle and wire strikes, degraded visibility, system component failures and fuel issues. Research shows that measures to improve crash survivability may include helmets, crash-resistant fuel systems, crash-worthy seats and upper-torso restraints, seatbelt airbag systems and deployable emergency locator transmitters, said IHST.
Night Flying
USHST analysis of six years3 of U.S. accident data revealed that 48 percent, or 21 of 44, of all helicopter accidents that occurred at night in non-emergency or “other” operations involved pilots with fewer than 100 hours of night flight experience (Table 1). Pilots with 100 to 499 hours of nighttime flying experience were involved in 25 percent of the 44 accidents, and pilots with 500 or more hours were involved in nine of the accidents, or 20 percent. Overall, pilots with fewer than 500 hours of nighttime flying experience were involved in 78 percent of the nighttime flying accidents.
| Nighttime Experience | Emergency Operations | Other Operations | ||
|---|---|---|---|---|
| Accidents | Share | Accidents | Share* | |
|
* Does not total 100% because of rounding. Note: Other operations do not include emergency medical services, fire fighting or law enforcement. Source: U.S. Helicopter Safety Team |
||||
| 0–99 hours | 4 | 9% | 21 | 53% |
| 100–499 hours | 16 | 36% | 10 | 25% |
| 500+ hours | 24 | 55% | 9 | 23% |
| Totals | 44 | 40 | ||
USHST said a closer look at the operations in the “other” category showed that private/personal flying and instructional operations were especially susceptible to accidents at night, with most involving pilots with fewer than 100 hours of nighttime flying experience.
When USHST looked at accidents that happened during nighttime emergency operations, such as emergency medical services, fire fighting or law enforcement, it found that pilots with 500 or more hours of night flying were involved in 55 percent of the 40 accidents. Pilots with 100 to 499 hours of night flying experience were involved in 40 percent, or 16 of the 40 accidents, and pilots with fewer than 10 hours were involved in 9 percent. “In large part, this is due to the fact that most pilots flying these emergency missions have accumulated a lot of night flight experience and they are frequently flying in challenging conditions,” USHST said. “But the data also illustrate that even the most experienced pilots have accidents in nighttime conditions.”
General Aviation Forecast
The U.S. fleet of active4 general aviation aircraft is projected to grow at an average annual rate of 0.4 percent from an estimated 198,860 in 2014 to 214,260 by 2035, according to the FAA Aerospace Forecast Fiscal Years 2015-2035, which was released in March. The number of turbine-powered aircraft, including rotorcraft, is expected to grow at an average rate of 2.4 percent per year over the forecast period to 45,905 aircraft. The number of active piston-powered aircraft, including rotorcraft, is forecast to decrease at an annual average rate of 0.5 percent from the 2014 total of 139,890 to 125,935 by 2035. The piston-powered rotorcraft segment of that fleet, however, is expected to grow at a rate of 2.1 percent per year.
Notes
- The accident rate reported for 2013 was changed in December to 4.95 per 100,000 flight hours from the previously reported 4.20 following the release of the FAA’s 2013 General Aviation and Part 135 Activity Survey, which contained more accurate 2013 flight hours.
- For its 2001–2005 baseline, and its 2006–2010 and 2012–2013 rate calculations, the USHST sourced flight hour figures from the FAA’s 2013 General Aviation and Part 135 Activity Survey. It used the FAA’s fiscal year 2014–2034 Aerospace Forecast as the source of flight hours for 2011 and 2014.
- USHST said it looked at accident data from 2000, 2001, 2006, 2009, 2010 and 2011.
- FAA defines an “active” aircraft as one that flies at least one hour during the year.