The European Aviation Safety Agency (EASA) plans to conduct a “focused analysis” to understand why the rate of serious incidents involving commercial air transport (CAT) airplanes (maximum takeoff weight of more than 5,700 kg/12,560 lb) operated by carriers from EASA member states (MS) increased dramatically in 2016 from the previous year. In recently releasing its Preliminary Safety Review — 2017, EASA said the rate of serious incidents was 16 per 1 million flights in 2016, which is an increase of 77.8 percent from the nine serious incidents per million flights reported for 2015. The accident rate, however, declined 43 percent to three accidents per million flights, the agency said.
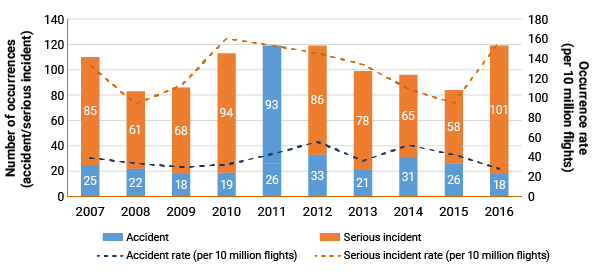
In 2016, EASA member state CAT operations suffered 18 accidents — one fatal — and 101 serious incidents. In 2015, EASA carriers recorded 26 accidents and 58 serious incidents. The 101 serious incidents last year are the most since 2010 and 2011, when there were 94 and 93, respectively. The 18 accidents represent the lowest number since 2009, where there also were 18 accidents.
The only fatal accident last year involved a Bombardier CRJ-200 flown by a cargo operator. The plane crashed in Sweden on Jan. 8, 2016, during a night flight from Oslo to Tromso, Norway. Both pilots, the only two people on the flight, were killed (see “Upset by a False Cue”). In the last decade, there have been 12 fatal accidents involving operators from EASA member states, and one each year since 2014.
The number of accidents and serious incidents for 2007–2016 is shown in Figure 1. From 2012 through 2015, the overall trend in serious incidents was downward, but the number of serious incidents spiked upward in 2016 by 74 percent. EASA said the increase is primarily attributable to occurrences relating to aircraft system technical failures, runway excursions and loss of separation events.
Figure 1 — Number and Rate of EASA Member State Commercial Air Transport Airplane Accidents and Serious Incidents, 2007–2016
Source: European Aviation Safety Agency (EASA)
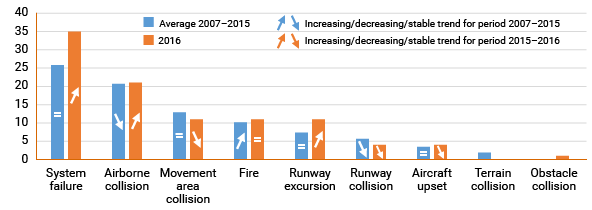
Figure 2 compares the average number of EASA MS commercial air transport accidents and serious incidents for 2007–2015 with 2016 and groups all the occurrences into key risk areas. Occurrences in the system failure and runway excursion risk areas both increased in 2016 relative to the average for each in the 2007–2015 period. Also, occurrences under the airborne collision risk area increased slightly after trending downward in 2007–2015.
Figure 2 — EASA Member State Operator Accidents and Serious Incidents by Key Risk Area (Average 2007 to 2015 Compared to 2016)
Source: European Aviation Safety Agency (EASA)
Aircraft upsets represent only 3 percent of the accidents and serious incidents involving EASA MS operators in 2016; however, aircraft upset continues to be the “most fatal risk area” for EASA MS operators, the agency said. “In 2016, the preliminary impact assessment on “loss of control—in flight” indicated the need for specific actions in the area within the European Plan for Aviation Safety, which is a key strategic document for improving safety at the European level, EASA said.
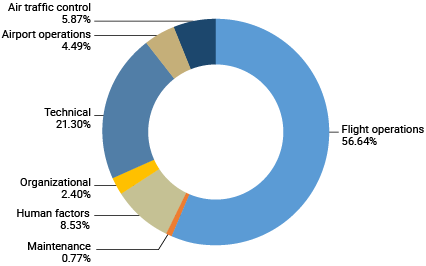
Figure 3 shows the origins of the causal and contributory factors behind the accidents and serious incidents involving EASA MS operators between 2007 and 2016. The majority of the causal and contributory factors originated in flight operations. Technical factors account for slightly more than 21 percent of the causal and contributory factors.
Figure 3 — Origins of the Accidents and Serious Incidents for EASA Member State Operators
Source: European Aviation Safety Agency (EASA)
Worldwide, both fatal accidents and fatalities declined in 2016 from the previous year for CAT large airplane operations, EASA said. Last year there were eight fatal accidents and 255 fatalities recorded around the world, compared with nine fatal accidents and 307 fatalities, EASA said. Of the eight fatal accidents in 2016, six were passenger flights and two were cargo flights. Three of the eight occurred during the en route phase of flight, three during approach and landing, one during pushback and one during takeoff.
Security-related events, such as the Russian Metrojet crash in Egypt in 2015 and Malaysia Airlines Flight MH17, which was shot down over Ukraine in 2014, are not included in the totals. The Germanwings accident, in which investigators believe the copilot intentionally crashed the airplane to commit suicide; the EgyptAir A320 crash in 2016, which has not been confirmed as terrorist action; and MH370, which is still missing, are included in the global statistics.
IATA Safety Report
Separately, the International Air Transport Association (IATA) said that the global commercial air transport industry’s safety record improved by 54 percent between 2007 and 2016.
Safety Report 2016 — made public in April, several weeks after the release of preliminary data — said the 2016 accident rate of 1.61 accidents per million flight sectors was 10 percent lower than the 2015 rate.
Overall, 2016 performance included 268 fatalities, an increase of 97 percent over 2015 but still below the previous five-year average of 371. Ten fatal accidents were recorded in 2016, up from four in 2015; of the 10 accidents, six involved cargo flights, IATA said. Two of the fatal accidents involved EgyptAir Flight 804, an Airbus A320 that crashed into the Mediterranean Sea on May 19, killing all 66 passengers and crew, and LaMia Flight 2933, an Avro RJ85 that crashed near Rionegro/Medellín Airport on Nov. 28, killing 71 of the 77 passengers and crew. The IATA report includes only fatalities involving people in the airplane, not those who are killed on the ground.
In other developments, data showed significant improvement in 2016 in Africa, where the overall accident rate was 2.30 per million sectors and the turboprop accident rate was 3.31 per million sectors (down 42 percent from the 2011–2015 annual average).
