
Noncompliance with standard operating procedures (SOPs) — especially tolerance of unstabilized approaches — is a serious impediment to further reduction of accident risk, according to United Airlines safety leaders.
During his April presentation to the World Aviation Training Conference and Tradeshow (WATS 2015) in Orlando, Florida, U.S., Chris Sharber, a first officer and flight simulator instructor–Boeing 777 fleet, at the United Airlines Training Center in Denver, described the issue as invisible and insidious. United Airlines safety leaders echoed this theme in a keynote address and in presentations about analytical techniques and related insights from the company’s safety management system (SMS), including analysis of flight crews’ voluntary safety reports.
“We have somewhere between 11,000 and 12,000 pilots. Our new-hire department will bring another 1,000 pilots on board in the next 12 to 15 months,” Sharber said. “One of the challenges that you face with that many pilots, of course, is SOP compliance. How do you influence a group of 11,000 individuals to focus on SOP compliance, to maintain the tight standardization that’s required to maintain safe operations in a global airline?”
A key part of the solution has been to leverage the experience and influence of instructor-evaluators, flight instructors, simulator evaluators and line check airmen. In the most recent annual training review meeting of this entire group to identify safety, standardization and training issues, SOP compliance was raised as a significant concern. “The reason we’re sharing [this presentation] with you today is because the issues that we have are not unique to our airline,” Sharber told the attendees. The human factors involved also are not unique to aviation, he added, reviewing the original investigative commission’s findings and recent academic analyses of the Challenger accident on Jan. 28, 1986.
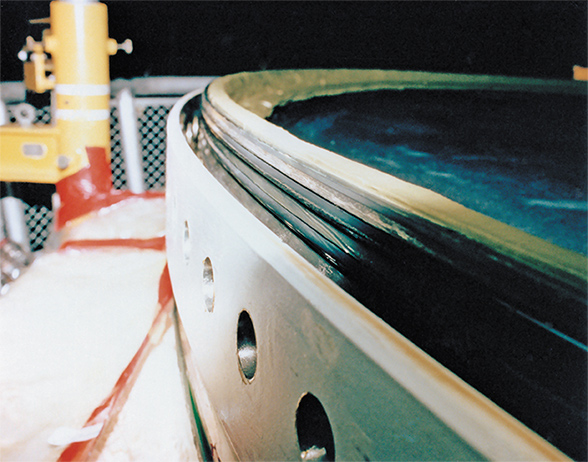
One of the academic analyses argues that although everyone involved was accustomed to mission-completion pressure as a factor in decisions regarding a Challenger launch, the fact that 24 previous launches had been successful with known leaks in seals (called O-rings) between rocket stages may have been the most important human factor, he said. Today, the term normalization of deviance — the gradual process by which the unacceptable becomes acceptable in the absence of adverse consequences — can be applied as legitimately to the human factors risks in airline operations as to the Challenger accident. “The shortcut slowly but surely over time becomes the norm,” in other words, he said.
Data Without Action
United Airlines pointed to the ironic possibility today of operating flights in an environment rich with objective quantitative/qualitative safety data and predictive analytics but not necessarily the will to take action. “Now we live in the data age, where we’re aware not only of what has happened but now we are aware of what might happen,” Sharber said. “In FOQA [flight operational quality assurance programs], the airplane gives us objective information. From ASAP [aviation safety action programs], we get the human story from the pilots themselves. We have the LOSA [line operations safety audit] study, [so] now we get information from objective outside observers. … So if SOPs and [other] procedures are based on all that valid information, why then would crews not comply?”
Several articles in AeroSafety World have covered recent research, including some led by Flight Safety Foundation, that offers credible answers, he said, citing the LOSA Collaborative’s data showing that acts of SOP unintentional noncompliance by airline flight crews occur slightly more often than twice per flight (ASW, 12/13–1/14). “Crews that are doing their absolute best to maintain the standard will have about two errors for every flight, so that’s our exposure — it happens every single day,” he said, because of lack of knowledge, unawareness of the SOP, improper training, insufficient study and the catchall term, just simple human error.
A particularly strong recent influence on such errors has been adapting to SOP changes associated with airline mergers. “Reversion to old procedure — falling back to old procedures — … has been a factor for my airline and for our industry here in North America, particularly the last several years,” he said. Training specialists joke that whether the merging airlines totally adopt the SOPs of one airline or create a combination of the best SOPs of each airline, “Either way you end up with a situation where you either have 100 percent of your pilots that are 50 percent confused or 50 percent of your pilots that are 100 percent confused. But you have a situation ripe for reversion to … the way they used to do things out of habit,” Sharber said. This also can be influenced by the cultural gaps in flight deck interactions among pilots of the same or different age groups, which sometimes affect their mutual tolerance of SOP deviations, he added.
“When you revert to something [while flying] with someone who doesn’t share your background, you are exposed to greater risk because you’re reverting to something that they don’t understand. And the studies tell us that reversion is most common during the first 30 days of a change,” Sharber said.
Intentional Noncompliance
Flight crews engage in intentional noncompliance — and sometimes self-justify this behavior — out of a variety of motivations. “Maybe it’s a bad SOP. Maybe there are competing priorities. Maybe it just doesn’t work. It’s not functional. … It’s not that important. It doesn’t really matter. I might [take a] shortcut just because I’m trying to save time,” he said. “[Or pilots rationalize], ‘I just don’t like it. I like the way we did it before. I’ve got a better way of doing things. I think this is a bad idea. I’m just not going to do it.” These occur with a perceived lack of consequences. The LOSA Collaborative’s latest data analysis suggests that acts of intentional noncompliance occur on between 40 to 60 percent of flights, or about half, on average.
For both types of noncompliance with SOPs, the categories and subcategories can be graphed (Figure 1) in their SMS context for a quick understanding of the safety influence of these behavioral ranges, with intentional reckless behavior showing disregard of significant risk at the extreme ends.
Figure 1 — Visualizing Extremes of SOP Noncompliance
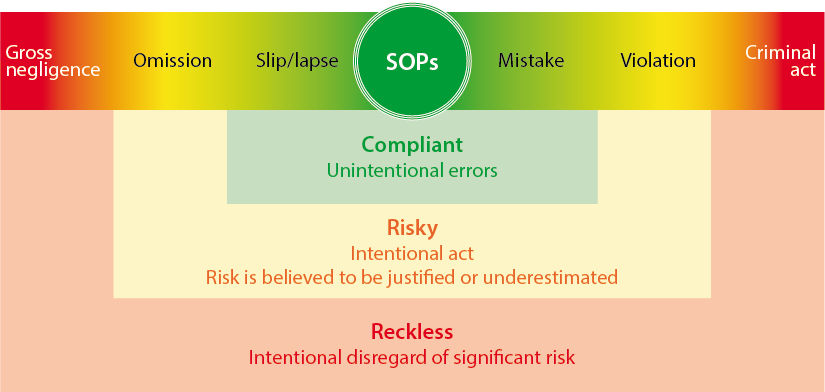
SOP = standard operating procedure
Source: United Airlines
Unstabilized Approaches
Sharber said this background has been a good framework for discussion of one specific intentional act of noncompliance: landing from an unstabilized approach as opposed to going around per airline policy and standards. He cited, and urged attendees to study, numerous FSF task force and consultant reports and ASW articles about the ongoing effort to understand, assess safety impact and mitigate this issue (ASW, 4/13).
Every airline should be tracking stabilized approach data about its average rate, the corresponding industry rate and the airline’s and industry’s average ratio of stabilized approaches to unstabilized approaches (Figure 2). “If you know the answers to those questions … that demonstrates you’re above average in the industry … because [an FSF] survey shows that pilots and management in general don’t know the answers to those questions,” he said.
Figure 2 — Small Numbers, High Severity
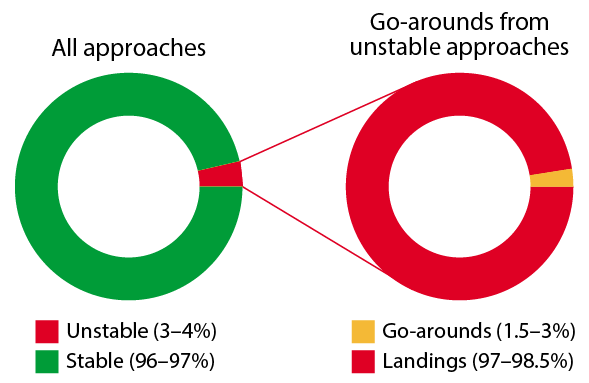
Note: Knowledge of airline-level data reduces probability of landing accidents.
Source: United Airlines
“The LOSA Collaborative and an Airbus study show that the industry’s average stabilized approach rate is about 96 to 97 percent. … If you are at the top of the industry in this regard, your unstabilized approach rate may be as low as about 1.5 percent, which is even more remarkable. … The studies show that somewhere between 1.5 and 3 percent of [crews flying] unstabilized approaches do the right thing and execute a go-around.”
Sharber suggested, for a perspective of the significance to risk exposure, that attendees run the numbers for a hypothetical airline that has 1,800 departures a day. “That would yield about 657,000 flights in a year [and] would result in about 54 unstabilized approaches per day, [19,710] unstabilized approaches per year. Take the same percentage of the go-around numbers and what do you get? That would result in about 1.6 go-arounds per day — about 600 go-arounds per year. The remainder [are] unstabilized approaches that continue to land … 52 per day, 19,000 per year. That puts it in a little different light.” Moreover, those with a 1.5-percent unstabilized approach rate still end up with almost 10,000 unstabilized landings per year.
The conclusion that the airline reached is that the status quo is unsustainable. “NASA [the U.S. National Aeronautics and Space Administration] got away with [launches of Challenger] 24 times. If you’re the average airline … your exposure is over 50 times per day, which begs the next question. How long can we get away with this as an industry? I would submit that the answer to that question is — we’re not. If you just think back over the last three years, think about some of the high-profile accidents in the industry, [several are] approach and landing accidents that involved unstabilized approaches,” Sharber said. “It’s been an issue [and] the numbers haven’t changed significantly in 15 years. We really don’t have any data that scientifically explain why. We have guesses and conjecture and hypotheses but no scientific data to back it up. Why has this not been more of a focus? If we could [eliminate] 50 percent of our accidents in the industry by this one thing, why are we not moving the needle?”
United Airlines Mitigations
 United Airlines also has been influenced by continuing FSF go-around research that has helped to establish the parts that pilots, management, air traffic control and other stakeholders play in the situation, he said. “Monitoring pilots are uncomfortable confronting the flying pilots when an unstabilized approach presents itself. … The pilots feel that there’s no disincentive for noncompliance. In other words, they have the perception that this is not an emphasis from management, [that] management doesn’t really care. [The Presage Group research for the Foundation] found that to be critical,” he said.
“In 2010, at United Airlines, we revamped our go-around policies, our go-around procedure, our stabilized-approach criteria for our pilots. … We divide our go-around policy and our stabilized-approach criteria into three components … plan, report, reject. The plan starts at 1,500 ft. At 1,500 ft, the crew has to plan to have the gear down and airspeed 180 [kt] or less. That’s the first gate. The second plan [element is] by 1,000 ft, have everything else done. That’s day/night/VMC/IMC [visual/instrument meteorological conditions]. We got rid of the 1,000 ft for night/IMC and 500 ft for day/VMC. It’s 1,000 ft every day all the time. We simplified it. As one of the other components of this, airspeed [allowed is] plus 15 [kt to] minus 5 [kt]. So we give [flight crews] a 20-kt window to allow for some variability.”
If the approach is not stabilized by 1,000 ft, the SOP allows the descent to continue, but that requires a callout of the deviation, including the deviation type, by the monitoring pilot. “The policy clearly states it also requires immediate corrective action by the flying pilot to address that issue. So now you have until 500 ft to get it fixed, and if you do, then you’re stabilized,” Sharber said. “But by 500 feet, if you don’t have everything done, that is … the limit. At 500 ft, [the SOP] mandates a ‘go around’ callout by the monitoring pilot. The monitoring pilot calls out ‘go around’ and the reason for the go-around — airspeed, descent rate, configuration, whatever the case may be. And the policy also clearly states that the only acceptable response from the flying pilot to that call is the execution of a missed approach. We made it mandatory.”
The company’s FOQA data analyses since the SOP’s implementation and other indicators show several positive results, but also room to improve. “Our FOQA data show that since we implemented this policy, we’ve demonstrated a four-year, consecutive year-over-year improvement in our unstabilized approach rate. In fact, the data show it’s about a 22 percent improvement in the number of unstabilized approaches at our airline,” he said. “It also shows that we moved the needle a little bit with regard to go-around compliance. … It hasn’t solved the problem but it helped.”
Featured image: Susan Reed
O-rings: U.S. National Aeronautics and Space Administration
United Airlines airplanes: © Rabbit75 | Dreamstime.com

