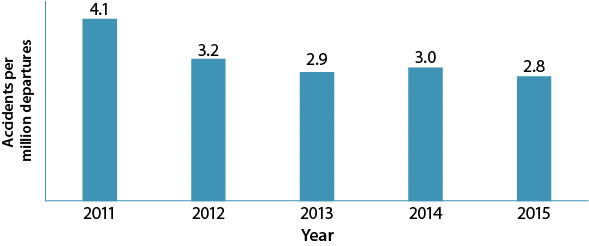
The global accident rate for scheduled commercial operations involving aircraft with a maximum takeoff weight (MTOW) of more than 5,700 kg (12,566 lb) declined to 2.8 accidents per 1 million departures in 2015 — its lowest point in the past five years, according to the ICAO Safety Report 2016 Edition, released in July by the International Civil Aviation Organization (ICAO). The 2014 accident rate was 3.0 accidents per million departures (Figure 1).
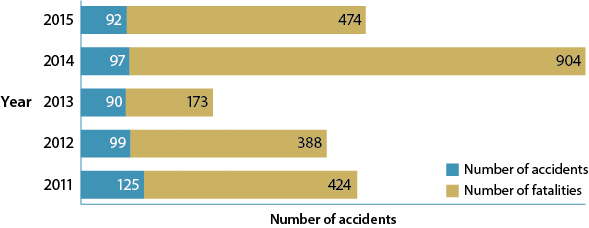
The ICAO statistics for 2015 show declines in the number of accidents, the number of fatal accidents and the number of fatalities when compared to 2014 data. The total number of scheduled commercial aviation accidents declined to 92 last year. That represents a 5.1 percent improvement from 2014’s 97 accidents, but still is greater than the 90 accidents recorded in 2013, which is the low point for the five-year period under review. The number of fatalities recorded in 2015 fell sharply from 2014, but still was significantly higher than in 2013 (Figure 2).
“The 474 fatalities in 2015 represent a substantial decrease from the 904 fatalities in 2014, despite the tragic events of the Germanwings and Metrojet accidents, which caused significant loss of life,” the ICAO report said. “The aviation community remains focused on achieving the highest level of cooperation among the various safety stakeholders. To keep pace with expansion and progress sector-wide, ICAO continues to promote the development and implementation of new safety initiatives.”
The crash of Germanwings Flight 9525 in March 2015 killed 150 passengers and crew, including the co-pilot, who investigators determined intentionally flew the aircraft into the ground in the French Alps. The October crash of Metrojet Flight 9268 in Egypt resulted in the deaths of 224 passengers and crew. ICAO has placed Germanwings in the “other” category and Metrojet in the “unknown” category.
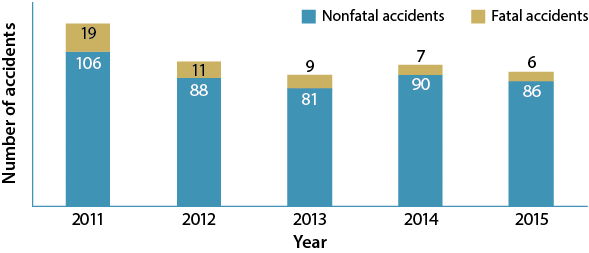
The number of fatal accidents in scheduled commercial aviation last year declined to six, from seven in 2014 and nine in 2013. Fatal accidents in the past five years peaked at 19 in 2011 (Figure 3).
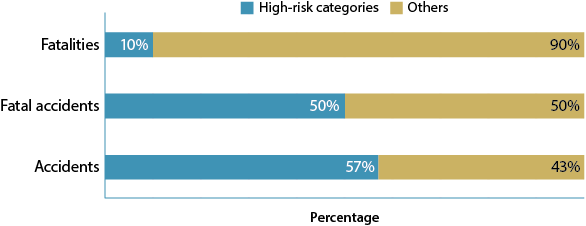
ICAO has identified runway safety–related events, loss of control–in flight (LOC–I) and controlled flight into terrain (CFIT) as high-risk accident occurrence categories (HRC). According to ICAO analysis, these three high-risk categories accounted for 57 percent of accidents, 50 percent of fatal accidents and 10 percent of fatalities in 2015 (Figure 4).
Figure 4 —High-Risk Category Accident Distribution
Note: ICAO has identified runway-safety related events, loss of control–in flight and controlled flight into terrain as high-risk accident occurrence categories, and uses these categories as a baseline in its safety analysis.
Source: ICAO Safety Report 2016 Edition
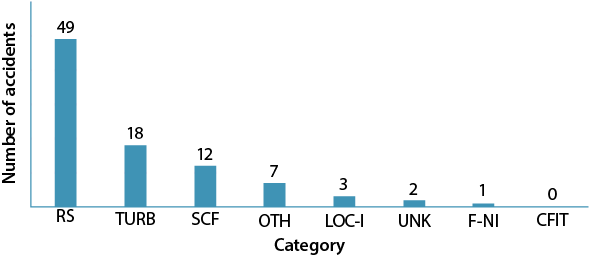
For the first time in recent history, scheduled commercial operations did not suffer any CFIT accidents in 2015. Runway safety-related events accounted for 53 percent of all accidents last year and 17 percent of fatal accidents, but only 0.2 percent of all fatalities. LOC-I accounted for 3 percent of all accidents, but 33 percent of fatal accidents and 9 percent of fatalities, ICAO said. The Germanwings and Metrojet accidents accounted for 79 percent of all fatalities recorded in 2015. Eighteen accidents fell into the turbulence encounter category and 12 into the system component failure category (Figure 5).
Figure 5 — Commercial Aviation Accidents by Category, 2015
CFIT = controlled flight into terrain; F-NI = fire–non-impact; LOC-I = loss of control–in flight; OTH = other; RS = runway safety; SCF = system component failure; TURB = turbulence encounter; UNK = unknown
Source: ICAO Safety Report 2016 Edition
ICAO analyzes safety data based on its Regional Aviation Safety Group (RASG) geographic areas. There are five RASGs: Pan America (PA), which comprises North and South America and the Caribbean, Africa (AFI), the Middle East (MID), Europe (EUR) and the Asia and Pacific (APAC) region (Table 1).
| RASG | Estimated Departures (in millions) |
Percent of Departures |
Accidents | Accident Rate** |
Fatal Accidents |
Fatalities |
|---|---|---|---|---|---|---|
|
AFI = Africa; APAC = Asia and Pacific; EUR = Europe; MID = Middle East; PA = Pan America; RASG = regional aviation safety group Notes: *One accident occurred in oceanic airspace and is not attributed to any region. Source: ICAO Safety Report 2016 Edition |
||||||
| AFI | 0.8 | 2% | 6 | 7.3 | 0 | 0 |
| APAC | 9.8 | 30% | 24 | 2.5 | 3 | 98 |
| EUR | 8.1 | 25% | 24 | 3.0 | 1 | 150 |
| MID | 1.2 | 3% | 3 | 2.5 | 1 | 224 |
| PA | 13.0 | 40% | 34 | 2.6 | 1 | 2 |
| World | 32.9 | — | 92* | 2.8 | 6 | 474 |
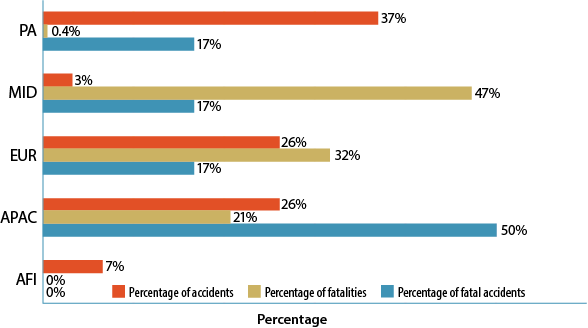
The PA region, which is one of the largest regions geographically, accounted for roughly 13 million, or 40 percent, of worldwide scheduled commercial departures in 2015, and for about 37 percent, or 34, of the 92 total accidents (Figure 6). The region had only one fatal accident and two fatalities. The region’s overall accident rate was 2.6 accidents per million departures. The APAC and MID regions had the lowest accident rates at 2.5 accidents per million departures each. The EUR accident rate was 3.0 and the AFI rate was 7.3 accidents per million departures.
Figure 6 — Accident Overview by RASG Region
AFI = Africa; APAC = Asia and Pacific; EUR = Europe; MID = Middle East; PA = Pan America; RASG = regional aviation safety group
Note: Numbers do not total 100 percent because of rounding.
Source: ICAO Safety Report 2016 Edition
The EUR and MID regions, with the Germanwings and Metrojet accidents, accounted for 32 and 47 percent, respectively, of all the fatalities. The APAC region, however, had half of the fatal accidents — three, which resulted in 98 fatalities. The AFI region did not suffer any fatal accidents in 2015.
Each ICAO member state is expected to establish and implement an effective safety oversight system, and ICAO’s Universal Safety Oversight Audit Programme Continuous Monitoring Approach (USOAP CMA) is intended to measure the effective implementation (EI) of a state’s safety oversight program. To standardize audits conducted as part of USOAP CMA, ICAO has established protocol questions that are based on its safety-related standards and recommended practices established in the various annexes to the Chicago Convention, Procedures for Air Navigation Services, ICAO DOC-series documents and guidance material. Each protocol question contributes to assessing the effective implementation of one of eight critical elements in one of the eight audit areas. USOAP results for 2015 show that the EI percentage is highest in the airworthiness audit area (73.5 percent) and lowest in accident investigation (54.4 percent).
Six years ago, ICAO, the U.S. Department of Transportation, the European Commission and the International Air Transport Association (IATA) signed a memorandum of understanding on a Global Safety Information Exchange (GSIE), the object of which is to identify information that can be exchanged between the parties to enhance risk reduction activities. The GSIE developed a harmonized accident rate through close cooperation between ICAO and IATA to align accident definitions, criteria and analysis methods. The joint analysis includes accidents meeting the ICAO Annex 13, Aircraft Accident and Incident Investigation, criteria for all typical commercial airline operations for scheduled and non-scheduled flights, ICAO said.
A total of 104 accidents, including scheduled and non-scheduled commercial operations and ferry flights for aircraft with an MTOW of more than 5,700 kg were considered as part of the harmonized criteria. The GSIE accident rate last year was about 2.75 accidents per million sectors, down from nearly 3.5 accidents per million sectors in 2014. The harmonized injuries-to-persons accident rate was just under 0.5 per million sectors.
GSIE has seven accident categories: CFIT, LOC-I, runway safety (RS), ground safety, operational damage (OD), injuries to and/or incapacitation of persons (MED), other and unknown. More than 50 of the 104 accidents considered under GSIE were categorized as RS-related, with the next two most common categories — MED and OD — both coming in at just under 20 accidents each. RS events include runway excursions and incursions, undershoot/overshoot, tail strike and hard landing events. OD is defined as damage sustained by the aircraft while operating under its own power, and includes in-flight damage, foreign object debris and all system or component failures. MED covers all injuries or incapacitations sustained by anyone coming into direct contact with any part of the aircraft structure. It includes turbulence-related injuries; injuries to ground staff coming into contact with the structure, engines or control surfaces; and on-board injuries or incapacitations and fatalities not related to unlawful external interference.
