On-board fatalities in crashes involving Western-built commercial jets1 declined to zero in 2015, down from 278 fatalities in 2014, according to data from Boeing Commercial Airplanes. The death toll for people on the ground — killed in three separate accidents — totaled 16; the comparable 2014 figure was one.
Boeing’s annual Statistical Summary of Commercial Jet Airplane Accidents,2 published in July, reported 28 accidents involving Western-built commercial jets in 2015; six of the accident airplanes were destroyed.3 By comparison, in 2014, airplanes were destroyed in three of 29 accidents involving Western-built commercial jets.
Seven of the 28 accidents in 2015 were considered major accidents — a term defined by Boeing to describe an accident in which any of these three conditions is met: The airplane was destroyed, the accident resulted in multiple fatalities, or the accident involved one fatality and substantial damage to the airplane.
Boeing’s data show a total of 386 crashes, including 65 fatal crashes for the 10-year period from 2006–2015, down from 404 crashes and 72 fatal crashes for the previous comparable period of 2005–2014 (Table 1). On-board fatalities in 2006–2015 totaled 3,191, compared with 3,946 for the previous period.
| Type of operation | All Accidents |
Fatal Accidents |
On-board Fatalities (External Fatalities)* |
Hull Loss Accidents | ||||
|---|---|---|---|---|---|---|---|---|
| 1959– 2015 |
2006– 2015 |
1959– 2015 |
2006– 2015 |
1959– 2015 |
2006– 2015 |
1959– 2015 |
2006– 2015 |
|
|
*External fatalities include ground fatalities and fatalities on other aircraft involved, such as helicopters or small general aviation airplanes, that are excluded. Source: Boeing Commercial Airplanes |
||||||||
| Passenger | 1,525 | 312 | 495 | 48 | 29,165 (800) | 3,133 (82) | 717 | 115 |
| Scheduled | 1,404 | 288 | 449 | 45 | 25,039 | 3,117 | 647 | 118 |
| Charter | 121 | 24 | 46 | 3 | 4,126 | 16 | 70 | 7 |
| Cargo | 269 | 63 | 80 | 14 | 273 (350) | 41 (23) | 180 | 37 |
| Maintenance test, ferry, positioning, training and demonstration | 124 | 11 | 44 | 3 | 208 (66) | 17 (0) | 76 | 7 |
| Totals | 1,918 | 386 | 619 | 65 | 29,646 (1,216) |
3,191 (105) | 973 | 159 |
| U.S. and Canadian operators | 571 | 69 | 182 | 11 | 6,202 (381) | 26 (6) | 230 | 25 |
| Rest of the world | 1,347 | 317 | 437 | 54 | 23,444 (835) | 3,165 (99) | 743 | 134 |
| Totals | 1,918 | 386 | 619 | 65 | 29,646 (1,216) | 3,191 (105) | 973 | 159 |
From 1959, when Boeing’s record-keeping began, through 2015, data show a total of 1,918 accidents, including 619 fatal accidents with 29,646 on-board fatalities and 1,216 “external” fatalities involving people outside the airplane.
The fatal accident rate for the 2006–2015 period was 0.29 per million departures, the report said. That figure represents a decline from 0.32 per million departures for the previous 10-year period (Figure 1). The data also show a hull loss accident rate of 0.70 per million departures. Boeing uses the term hull loss to characterize an airplane that is “totally destroyed or damaged and not repaired.” The category also includes airplanes that are missing or inaccessible.
Figure 1 — 10-Year Accident Rates, by Type of Operation, Worldwide Commercial Jet Fleet, 2006–2015
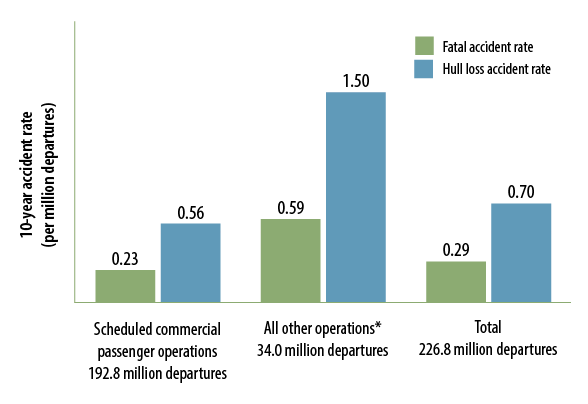
* Charter passenger, charter cargo, scheduled cargo, maintenance test, ferry, positioning, training and demonstration flights.
Source: Boeing Commercial Airplanes
Data show a total of 159 hull loss accidents from 2006–2015, including 55 fatal accidents and 104 without fatalities (Figure 2). From 1959 through 2015, data show a total of 973 hull loss accidents, including 502 that were fatal.
Figure 2 — Accidents, by Injury and Damage, Worldwide Commercial Jet Fleet

Source: Boeing Commercial Airplanes
More than half of all on-board fatalities recorded from 2006 through 2015 involved loss of control–in flight accidents — 1,396 (Figure 3). The second-largest number of onboard fatalities — 658 — resulted from controlled flight into terrain accidents, followed closely by 632 onboard fatalities in runway excursion accidents. Fatalities in these three categories far exceeded all others.
Figure 3 — Fatalities by CAST/ICAO Taxonomy Accident Category, Worldwide Commercial Jet Fleet, 2006–2015
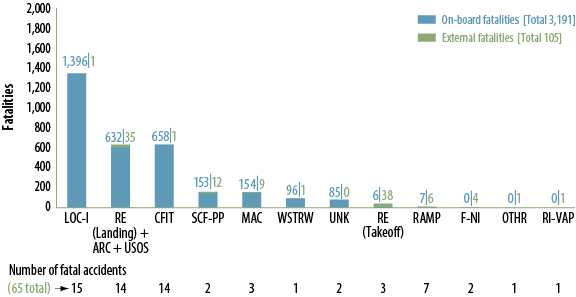
CAST = U.S. Commercial Aviation Safety Team; ICAO = International Civil Aviation Organization; ARC = abnormal runway contact; CFIT = controlled flight into terrain; F-NI = fire/smoke (non-impact); LOC-I = loss of control–in flight; MAC = midair/near-midair collision; OTHR = other; RAMP = ground handling; RE = runway excursion; RI-VAP = runway incursion – vehicle, aircraft or person; SCF-PP = system/component failure or malfunction (powerplant); UNK = unknown or undetermined; USOS = undershoot/overshoot; WSTRW = wind shear or thunderstorm.
No accidents were noted in the following principal categories: aerodrome; abrupt maneuver; air traffic management/communications, navigation, surveillance; bird strikes; cabin safety events; evacuation; external load-related occurrences; fire/smoke (post-impact); fuel related; ground collision; icing; low altitude operations; loss of control–ground; runway incursion–animal; security related; system/component failure or malfunction (non‑powerplant); turbulence encounter; wildlife.
Note: Principal categories are as assigned by CAST. Airplanes manufactured in the Commonwealth of Independent States or the Soviet Union are excluded because of lack of operational data. Commercial airplanes used in military service are also excluded.
Source: Boeing Commercial Airplanes
Nearly half of all fatal accidents from 2006 through 2015 occurred during final approach (26 percent of all fatal accidents and 27 percent of fatalities) and landing (23 percent of fatal accidents and 20 percent of fatalities), the report said.
An additional 12 percent of fatal accidents and 24 percent of fatalities occurred during cruise flight, the report said, adding that another 12 percent of accidents occurred during takeoff and initial climb. In addition, 11 percent of fatal accidents occurred during taxiing and other ground activities, 6 percent during climb, 2 percent during descent and 8 percent during initial approach.
Notes
- The data include worldwide commercial jet airplanes with maximum gross weight of more than 60,000 lb (27,217 kg), with two exceptions: airplanes manufactured in the Commonwealth of Independent States or the former Soviet Union, because of insufficient operational data, and commercial airplanes operated in military service. Airplanes destroyed by sabotage or terrorism also are excluded.
- Boeing Commercial Airplanes. Statistical Summary of Commercial Jet Airplane Accidents: Worldwide Operations, 1959–2015. July 2016. <www.boeing.com/resources/boeingdotcom/company/about_bca/pdf/statsum.pdf>.
- Boeing considers an aircraft to have been destroyed if “the estimated or likely cost of repairs would have exceeded 50 percent of the new value of the airplane had it still been in production at the time of the accident.”