Efforts to elevate safety standards in the commercial air transport industry in Africa contributed to a decline in 2016 in the number of total accidents, fatal accidents and fatalities in both jet and turboprop operations — and to a year with no fatal accidents in sub-Saharan Africa, according to the International Air Transport Association (IATA).1
IATA’s Safety Report 2016, made public earlier this year, says that in addition to the lack of fatal accidents, no jet hull loss2 accidents were reported in the 48 nations of sub-Saharan Africa,3 and the turboprop accident rate dropped to 3.31 per million flight sectors in 2016, down 42 percent from its 2011–2015 annual average.
“Clearly, the multi-year effort of aviation stakeholders to raise African safety standards is showing encouraging results,” said Gilberto Lopez Meyer, IATA senior vice president, safety and flight operations.
Overall, the report said, the global commercial air transport industry’s safety record improved 54 percent between 2007 and 2016, with a 2016 accident rate of 1.61 accidents per million flight sectors. In 2007, the accident rate was 3.53 per million sectors (Figure 1).
Figure 1 — Jet and Turboprop Accidents per Million Sectors, 2007–2016
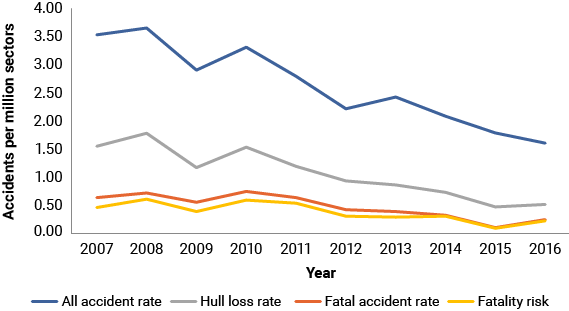
Source: International Air Tranport Association
The total accident rate in 2016 was 10 percent below the 2015 rate — with 65 total accidents, compared with 2015’s 68 (Table 1). The report added that “this overall positive performance was counterbalanced by an increase in the number of fatalities, fatal accidents and hull losses versus the previous year.”
| 2016 | 2015 | 5 Year Average (2011–2015) |
|
|---|---|---|---|
| Source: International Air Transport Association | |||
| Fatalities | 268 | 136 | 371 |
| Total Accidents | 65 | 68 | 81 |
| Fatal Accidents | 10 | 4 | 13.4 |
| Fatal Accidents Passenger Flights | 4 | 2 | 8.4 |
| Fatal Accidents Cargo Flights | 6 | 2 | 4.6 |
| Percent of Accidents Involving Fatalities | 15% | 6% | 16% |
| Jet Hull Losses | 13 | 10 | 10.6 |
| Jet Hull Losses with Fatalities | 5 | 0 | 5.5 |
| Turboprop Hull Losses | 8 | 8 | 19.6 |
| Turboprop Hull Losses With Fatalities | 5 | 4 | 9.2 |
Fatalities in 2016 totaled 268, up from 136 fatalities in 2015, the report said, adding that there were 10 fatal accidents, compared with four in 2015. Thirteen jet hull losses and eight turboprop hull losses were reported in 2016, up from 10 jet hull losses and eight turboprop hull losses in 2015.
Of 2016’s 10 fatal accidents, six involved cargo flights and four, passenger flights, including Egypt Air Flight 804, Airbus A320 that crashed into the Mediterranean Sea on May 19, killing all 66 passengers and crew, and LaMia Flight 2933, an Avro RJ that crashed near Medellín, Colombia, on Nov. 28, killing 71 of the 77 people in the airplane.4
Regional Rates
Regionally, the African region experienced its best safety performance in a decade, the report said, noting that the total accident rate fell 89 percent between 2007 and 2016 (Figure 2).
Figure 2 — African Region Jet and Turboprop Accidents per Million Sectors, 2007–2016
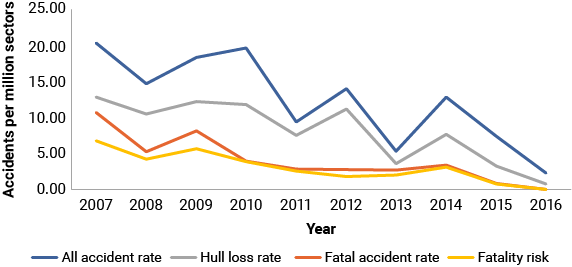
Source: International Air Transport Association
The lowest total accident rates in 2016 were in North Asia and North America, and the highest were in the Middle East and North Africa, and the Commonwealth of Independent States (Figure 3).
Figure 3 — Jet and Turboprop Accidents per Million Sectors by Region, 2016
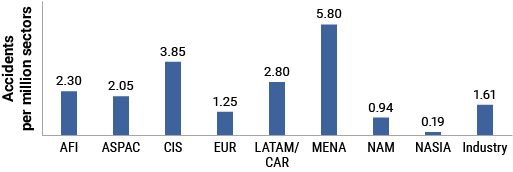
AFI = Africa; ASPAC = Asia/Pacific; CIS = Commonwealth of Independent States; EUR = Europe; LATAM/CAR = Latin America and the Caribbean; MENA = Middle East and North Africa; NASIA = North Asia
Source: International Air Transport Association
IATA’s breakdown of accidents occurring in Africa in 2016 found that all of them involved turboprop passenger aircraft. In comparison, over the five-year period from 2012 through 2016, 56 percent of accidents in Africa involved passenger aircraft, 35 percent involved cargo aircraft, and 8 percent involved ferry flights; 79 percent of the 2012–2016 accidents involved turboprop aircraft and 21 percent involved jets.
In an analysis of major contributing factors, IATA determined that regulatory oversight was the most frequently cited “latent condition” (52 percent) in 2012–2016 accidents in the Africa region, followed by safety management (44 percent) and management decisions (11 percent). The report defined latent conditions as “conditions present in the system before the accident, made evident by triggering factors … often [relating] to deficiencies in organizational processes and procedures.”
“Manual handling/flight controls” was the most frequently cited flight crew error (26 percent), followed by adherence to and cross-verification of standard operating procedures (19 percent), failure to go around after a destabilized approach (15 percent) and pilot-to-pilot communication (11 percent).
“Airport facilities” was most frequently cited (33 percent) in the “threats” category, followed by four items that each were cited in 19 percent of accidents: contaminated runway/taxiway — poor braking action, aircraft malfunction, meteorology and gear/tire. A threat was defined in the report as “an event or effort that occurs outside the influence of the flight crew but which requires flight crew attention and management to properly maintain safety margins.”
The most frequently cited undesired aircraft state — “a flight crew–induced aircraft state that clearly reduces safety margins; a safety-compromising situation that results from ineffective threat/error management” — was “long/floated/bounced/firm/off-center/crabbed land” (26 percent), followed by vertical/lateral/speed deviation (19 percent) and “abrupt aircraft control (11 percent).
The report said the most frequently cited countermeasures were overall crew performance (19 percent) and “captain should show leadership” (11 percent).
More accidents were in the category of runway or taxiway excursions than in any other category, the report said, and more accidents occurred during landing than in any other phase of flight.
World View
Worldwide, more accidents in 2016 were classified as runway/taxiway excursions (19 percent) than any other accident category, the report said. Gear-up/gear collapse was the second-largest accident category, with 16 percent of total accidents.
Eleven percent of 2016 accidents were classified as loss of control–in flight (LOC-I), and LOC-I accidents not only were responsible for more fatalities than any other category (79 people) but also contributed to “a higher ratio of people who perished, compared to the number of people on board” (Figure 4).
Figure 4 — Accident Frequency and Risk of Fatality, 2016
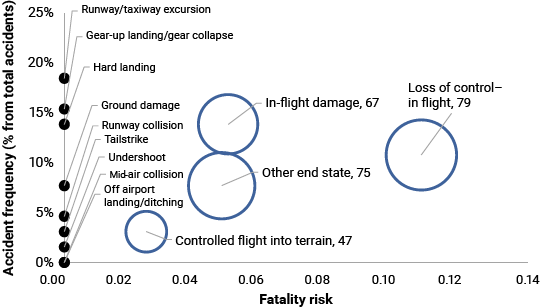
Source: International Air Transport Association
In addition, the report said, “LOC-I exposed passengers and crew to the highest risk of a catastrophic accident with no survivors, at a rate of about 0.11 accidents per million sectors. This translates into an exposure of one catastrophic accident for every 9.1 million sectors.”
Notes
- IATA. Safety Report 2016. April 2017. http://www.iata.org/docx/IATA-Safety-Report-2016-2.pdf.
- According to IATA’s definition, hull losses refer to “the aircraft being damaged beyond repair or the costs related to the repair being above the commercial value of the aircraft.”
- Sub-Saharan Africa includes all of Africa except the most northern countries — Algeria, Egypt, Libya, Morocco and Tunisia — which are in the Middle East and North Africa region.
- The report’s data include only on-board fatalities.