Australian commercial air transport operations recorded 15 accidents in 2016, including one fatal accident that resulted in one fatality, the Australian Transport Safety Board (ATSB) says.
In its annual report, Aviation Occurrence Statistics, 2007 to 2016,1 issued in mid-January, the ATSB said the 15 commercial air transport accidents were among a total of nearly 230 aircraft accidents in Australia in 2016.
Twenty-one fatalities were reported in the Australian aviation industry in 2016 — the lowest number ever recorded by the ATSB, the agency said; in addition to the single fatality in commercial aviation, 10 fatalities were recorded in both the general aviation and recreational aviation categories.
The report said 291 aircraft were involved in serious incidents — incidents defined as having a high probability of an accident.
The absence of fatal accidents in 2016 in high capacity regular public transport (RPT) operations and low capacity RPT operations extended trends in both categories.2 High capacity RPT operations have been involved in no fatal accidents since 1975, and low capacity RPT operations have experienced none since 2010.
The report cited “aircraft control;” as the most common cause of an accident or serious incident for air transport operators in 2016, and “collision with terrain” as the most common type of accident or serious incident for general aviation aircraft.
Wildlife strikes, especially bird strikes, were the most common type of incident in both air transport and general aviation operations, the report said, and runway events were most common in recreational aviation.
10-Year Review
In addition to the 15 accidents in 2016, commercial air transport aircraft were involved in 3,901 incidents and 50 serious incidents, the report said (Table 1). In comparison, the 2015 totals included 3,837 incidents, 30 serious incidents and nine accidents, one of them fatal. At the start of the 10-year period, in 2007, 3,152 incidents, 47 serious incidents and 21 accidents, including two fatal accidents, were reported. Accident rates for 2016 were not available, but data showed a decline from 15.9 accidents (and 1.5 fatal accidents) per million departures in 2007 to 7.1 accidents (and 0.8 fatal accidents) per million departures in 2015.
| 2007 | 2008 | 2009 | 2010 | 2011 | 2012 | 2013 | 2014 | 2015 | 2016 | |
|---|---|---|---|---|---|---|---|---|---|---|
| Source: Australian Transport Safety Bureau | ||||||||||
| Number of aircraft involved | ||||||||||
| Incidents | 3,152 | 3,337 | 3,162 | 3,477 | 4,002 | 4,226 | 4,404 | 4,318 | 3,837 | 3,901 |
| Serious incidents | 47 | 52 | 27 | 37 | 28 | 47 | 54 | 36 | 30 | 50 |
| Serious injury accidents | 1 | 3 | 4 | 2 | 2 | 2 | 2 | 6 | 4 | 1 |
| Fatal accidents | 2 | 3 | 0 | 1 | 2 | 1 | 2 | 0 | 1 | 1 |
| Total accidents | 21 | 28 | 14 | 23 | 21 | 14 | 15 | 27 | 9 | 15 |
| Number of people involved | ||||||||||
| Serious injuries | 1 | 15 | 6 | 2 | 2 | 2 | 4 | 8 | 5 | 2 |
| Fatalities | 2 | 6 | 0 | 2 | 2 | 1 | 3 | 0 | 1 | 1 |
| Rate of aircraft involved | ||||||||||
| Accidents per million departures | 15.9 | 21.4 | 11 | 16.6 | 14.9 | 9.5 | 10.4 | 20.2 | 7.1 | N/A |
| Fatal accidents per million departures | 1.5 | 2.3 | 0 | 0.7 | 1.4 | 0.7 | 1.4 | 0 | 0.8 | N/A |
The increase in the number of incidents over the 10-year period reflected the increase in flying activities in most types of air transport aircraft, as well as an increased awareness of requirements to report incidents to the ATSB, the report said, noting that about 35 percent of the commercial air transport incidents involved bird strikes.
The number of accidents and serious incidents recorded in 2016 was consistent with the average number of reports in both categories over the 10-year period, the report said.
The commercial air transport accident rate fell to a 10-year low in 2015, the most recent year for which data were available, and the fatal accident rate continued to hover just above zero per million departures (Figure 1).
Figure 1 — Commercial Air Transport Accident and Fatal Accident Rates, 2007–2015
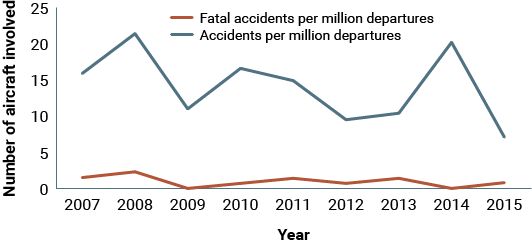
Source: Australian Transport Safety Bureau
Focusing on Australian-registered high capacity RPT, the data showed a 40 percent increase in the number of reported incidents from 2007 to 2016 — consistent with the 40 percent increase in the rate of departures. The ratio of incidents to departures has remained relatively constant, the report said, adding that, “provided these trends remain constant, the number of reported incidents would double every 17 years, with departures doubling every 18 years.”
Table 2 shows the increase over the 10-year period, from 1,916 incidents in 2007 to 2,760 incidents in 2016. The number of serious incidents, however, shifted from 16 in 2007, down to 10 in 2009 and up to a high of 23 in 2013; in 2016, there were 14 serious incidents. There were no fatal accidents during the 10-year period. No serious injury accidents were reported in 2016; throughout the period, there were no more than two serious injury accidents in any given year.
| 2007 | 2008 | 2009 | 2010 | 2011 | 2012 | 2013 | 2014 | 2015 | 2016 | |
|---|---|---|---|---|---|---|---|---|---|---|
|
RPT = regular public transport Source: Australian Transport Safety Bureau |
||||||||||
| Number of aircraft involved | ||||||||||
| Incidents | 1,916 | 2,130 | 2,016 | 2,428 | 2,853 | 3,108 | 3,282 | 3,220 | 2,736 | 2,760 |
| Serious incidents | 16 | 20 | 10 | 13 | 13 | 12 | 23 | 13 | 4 | 14 |
| Serious injury accidents | 1 | 1 | 1 | 2 | 1 | 0 | 1 | 2 | 2 | 0 |
| Fatal accidents | 0 | 0 | 0 | 0 | 0 | 0 | 0 | 0 | 0 | 0 |
| Total accidents | 3 | 3 | 1 | 2 | 3 | 1 | 2 | 2 | 3 | 2 |
| Number of people involved | ||||||||||
| Serious injuries | 1 | 12 | 1 | 2 | 1 | 0 | 1 | 2 | 2 | 0 |
| Fatalities | 0 | 0 | 0 | 0 | 0 | 0 | 0 | 0 | 0 | 0 |
| Rate of aircraft involved | ||||||||||
| Accidents per million departures | 6.8 | 6.1 | 2 | 3.7 | 5.4 | 1.6 | 3.2 | 3.2 | 4.8 | 3.1 |
| Fatal accidents per million departures | 0 | 0 | 0 | 0 | 0 | 0 | 0 | 0 | 0 | 0 |
| Accidents per million hours | 2.9 | 2.7 | 0.9 | 1.6 | 2.3 | 0.7 | 1.5 | 1.5 | 2.1 | 1.4 |
| Fatal accidents per million hours | 0 | 0 | 0 | 0 | 0 | 0 | 0 | 0 | 0 | 0 |
Accident rates in 2016 were 3.1 per million departures and 1.4 per million flight hours. In comparison, the 2007 rates were 6.8 per million departures and 2.9 per million hours.
Changing Options
The number of incidents involving low capacity RPT aircraft has declined significantly over the past 10 years, from 481 incidents in 2007 to 372 in 2016, the report said (Table 3). Over the same period, the number of serious incidents fell from eight to four. There were no accidents in 2016, and only four accidents (including one fatal accident) over the 10-year period.
| 2007 | 2008 | 2009 | 2010 | 2011 | 2012 | 2013 | 2014 | 2015 | 2016 | |
|---|---|---|---|---|---|---|---|---|---|---|
|
RPT = regular public transport Source: Australian Transport Safety Bureau |
||||||||||
| Number of aircraft involved | ||||||||||
| Incidents | 481 | 393 | 405 | 432 | 453 | 394 | 374 | 376 | 361 | 372 |
| Serious incidents | 8 | 11 | 4 | 6 | 2 | 5 | 3 | 1 | 5 | 4 |
| Serious injury accidents | 0 | 0 | 0 | 0 | 0 | 0 | 0 | 0 | 0 | 0 |
| Fatal accidents | 0 | 0 | 0 | 1 | 0 | 0 | 0 | 0 | 0 | 0 |
| Total accidents | 1 | 0 | 1 | 1 | 0 | 0 | 0 | 1 | 0 | 0 |
| Number of people involved | ||||||||||
| Serious injuries | 0 | 0 | 0 | 0 | 0 | 0 | 0 | 0 | 0 | 0 |
| Fatalities | 0 | 0 | 0 | 2 | 0 | 0 | 0 | 0 | 0 | 0 |
| Rate of aircraft involved | ||||||||||
| Accidents per million departures | 5.9 | 0 | 7.8 | 7.5 | 0 | 0 | 0 | 7.8 | 0 | 0 |
| Fatal accidents per million departures | 0 | 0 | 0 | 7.5 | 0 | 0 | 0 | 0 | 0 | 0 |
| Accidents per million hours | 6 | 0 | 9 | 8.6 | 0 | 0 | 0 | 8 | 0 | 0 |
| Fatal accidents per million hours | 0 | 0 | 0 | 8.6 | 0 | 0 | 0 | 0 | 0 | 0 |
The report said the declining numbers are primarily a result of a decrease in flight activity.
“This decline is a combined result of Australia’s changing requirements to support mining activity, with larger aircraft needed to move more people to regional cities, and mining communities and regional airlines using aircraft with larger seating capacities,” the report said. “This has moved many former low capacity flights into the high capacity type of operation with the additional regional travel options provided by high capacity RPT operators.”
Charter Operations
Charter transport operations in low capacity aircraft, which typically experience the highest number of accidents and fatal accidents and the highest accident rates, were involved in 11 accidents in 2016, including one fatal accident (Table 4). In comparison, over the 10-year period, annual accident totals ranged from a low of three in 2015 to a high of 25 in 2008.
| 2007 | 2008 | 2009 | 2010 | 2011 | 2012 | 2013 | 2014 | 2015 | 2016 | |
|---|---|---|---|---|---|---|---|---|---|---|
|
Source: Australian Transport Safety Bureau |
||||||||||
| Number of aircraft involved | ||||||||||
| Incidents | 521 | 553 | 492 | 357 | 401 | 398 | 398 | 395 | 446 | 393 |
| Serious incidents | 16 | 13 | 9 | 14 | 11 | 20 | 22 | 18 | 19 | 24 |
| Serious injury accidents | 0 | 2 | 1 | 0 | 1 | 2 | 1 | 4 | 0 | 1 |
| Fatal accidents | 2 | 3 | 0 | 0 | 2 | 1 | 2 | 0 | 1 | 1 |
| Total accidents | 16 | 25 | 8 | 20 | 18 | 12 | 12 | 23 | 3 | 11 |
| Number of people involved | ||||||||||
| Serious injuries | 0 | 3 | 2 | 0 | 1 | 2 | 3 | 6 | 1 | 2 |
| Fatalities | 2 | 6 | 0 | 0 | 2 | 1 | 3 | 0 | 1 | 1 |
| Rate of aircraft involved | ||||||||||
| Accidents per million departures | 24 | 39.5 | 13.1 | 30.2 | 27.7 | 18.3 | 19.4 | 43.9 | 6.6 | N/A |
| Fatal accidents per million departures | 3 | 4.7 | 0 | 0 | 3.1 | 1.5 | 3.2 | 0 | 2.2 | N/A |
| Accidents per million hours | 29.2 | 48 | 17 | 39.3 | 36.9 | 23.8 | 24.6 | 57 | 8.4 | N/A |
| Fatal accidents per million hours | 3.7 | 5.8 | 0 | 0 | 4.1 | 2 | 4.1 | 0 | 2.8 | N/A |
Charter accident rates were not available for 2016. Data showed that in 2015, there were 6.6 accidents per million departures and 8.4 accidents per million flight hours; the fatal accident rate was 2.2 per million departures and 2.8 per million hours.
Notes
- ATSB. Aviation Occurrence Statistics, 2007 to 2016. https://www.atsb.gov.au/media/5773880/ar-2017-104_final.pdf Jan. 15, 2018.
- High capacity regular public transport operations are those certified as having a maximum capacity of more than 38 seats or a maximum payload capability of more than 4,200 kg (9,259 lb). Low capacity regular public transport operations are those with a lesser capacity.