The worldwide major accident1 rate for Western-built commercial jets inched higher in 2015 to 0.2 accidents per million departures, up from the historic low of 0.13 per million departures the previous year. None of the six major accidents involving commercial jet transports was fatal, however (Table 1), and this represented a marked improvement over previous years. There were four major commercial jet transport accidents in 2014.
The accident tally does not include two fatal events involving large commercial jet aircraft — the Germanwings Airbus A320 that investigating authorities say was deliberately flown into the ground in the French Alps by its first officer on March 24, and the Metrojet A321 that is believed by investigators to have been destroyed by a bomb after departing Sharm el-Sheikh, Egypt, on Oct. 31. Together, these events killed all 374 passengers and crewmembers. Because they have been considered deliberate actions, they are not classified as aviation accidents.
| Date | Operator | Aircraft | Location | Phase | Fatalities | |
|---|---|---|---|---|---|---|
Source: Ascend |
||||||
| Jan. 10 | ASKY Airlines | B737 | Accra, Ghana | Landing | 0 | |
| March 4 | Turkish Airlines | A330 | Kathmandu, Nepal | Landing | 0 | |
| March 29 | Air Canada | A320 | Halifax, Canada | Landing | 0 | |
| April 14 | Asiana Airlines | A320 | Hiroshima, Japan | Landing | 0 | |
| April 25 | Turkish Airlines | A320 | Istanbul, Turkey | Landing | 0 | |
| Oct. 12 | Tristar Air | A300 | Afgooye, Somalia | Landing | 0 | |
Overall, commercial jets, commercial turboprops and business jets worldwide suffered 30 major accidents in 2015, down from 37 in 2014. A total of 15 of the major accidents last year were fatal accidents resulting in 231 deaths.
Eight of 2015’s overall fatal accidents involved commercial turboprop2 operations, down from 15 fatal accidents in 2014 and 19 in 2013 (Table 2). One of the accidents was a midair collision involving two turboprops. In addition, the 2015 toll included three fatal accidents involving scheduled passenger revenue flights.
| Date | Operator | Aircraft | Location | Phase | Fatalities | |
|---|---|---|---|---|---|---|
Source: Ascend |
||||||
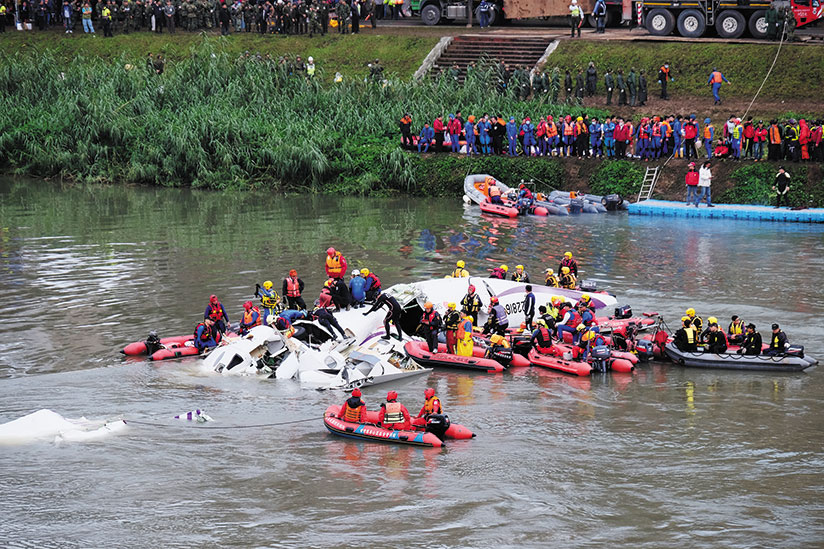
| Feb. 4 | TransAsia | ATR 72 | Taipei, Taiwan | Takeoff | 43 | |
| Feb. 11 | Aeropanamericano | BE1900 | Kendall, Florida, U.S. | Climb | 4 | |
| March 8 | SpiceJet | DHC-8 | Hubli, India | Landing | 0 | |
| April 13 | Carson Air | Metro II | Vancouver, Canada | Climb | 2 | |
| May 10 | Joy Air | MA60 | Fuzhou, China | Landing | 0 | |
| June 2 | Aeronaves TSM | Metro II | Querétaro, Mexico | Initial climb | 5 | |
| July 2 | Trans Maldivian Air | DHC-6 | Kuredu, Maldives | Landing | 0 | |
| Aug. 16 | Trigana Air Service | ATR 42 | Oksibil, Indonesia | Approach | 54 | |
| Aug. 20 | Dubnica Air | L-410 | Vršatec, Slovakia | En route | 3 | |
| Aug. 20 | Dubnica Air | L-410 | Vršatec, Slovakia | En route | 4 | |
| Sept. 6 | Rampart Aviation | DHC-6 | Raleigh, North Carolina, U.S. | Takeoff | 0 | |
| Oct. 2 | Aviastar Mandiri | DHC-6 | Sulawesi, Indonesia | En route | 10 | |
| Nov. 4 | Allied Services | AN-12 | Juba, South Sudan | Takeoff | 37 | |
| Nov. 10 | Westwind Aviation | HS 780 | Malakal, South Sudan | Takeoff | 0 | |
| Dec. 4 | SpiceJet | DHC-8 | Jabalpur, India | Landing | 0 | |
Four of the major accidents in 2015 were classified as controlled flight into terrain (CFIT). Two of these involved commercial jet transport aircraft that undershot the runway, and two involved commercial turboprop aircraft — one during the en route phase of flight and another during initial descent for landing.
Business jets were involved in 10 major accidents in 2015, five of which were classified as loss of control–in flight (LOC-I) accidents (Table 3). Hypoxia is believed to have been a factor in one of these accidents. Two of the 10 accidents were classified as runway excursions, and three others were unclassified. A midair collision is believed to have occurred in one of these unclassified accidents, based on preliminary information from inspection of another aircraft.
| Date | Operator | Aircraft | Location | Phase | Fatalities | |
|---|---|---|---|---|---|---|
Source: Ascend |
||||||
| Jan. 17 | Challenger Aero | Global 5000 | Tacloban, Philippines | Takeoff | 0 | |
| July 31 | Salem Aviation | Phenom | Blackbushe, U.K. | Approach | 4 | |
| Aug. 16 | BAE Systems | Sabreliner | San Diego, U.S. | Approach | 4 | |
| Sept. 5 | Senegal Air | HS 125 | Diourbal, Senegal | En route | 7 | |
| Oct. 19 | Top Air SA | Learjet 35 | San Fernando, Argentina | Takeoff | 0 | |
| Oct. 22 | Grupo Constructor Plata | Learjet 31 | Apaseo el Alto, Mexico | En route | 4 | |
| Nov. 10 | ExecuFlight | HS 125 | Akron, Ohio, U.S. | Approach | 9 | |
| Nov. 10 | Banco Badesco | Citation 650 | Guarda-Mor, Brazil | En route | 4 | |
| Dec. 7 | Dixco Transport | Eclipse 500 | Swellendam, South Africa | En route | 1 | |
| Dec. 23 | Aerolíneas Ejecutivas | BE400 | Telluride, Colorado, U.S. | Landing | 0 | |
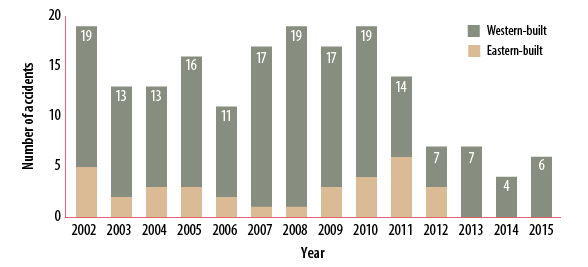
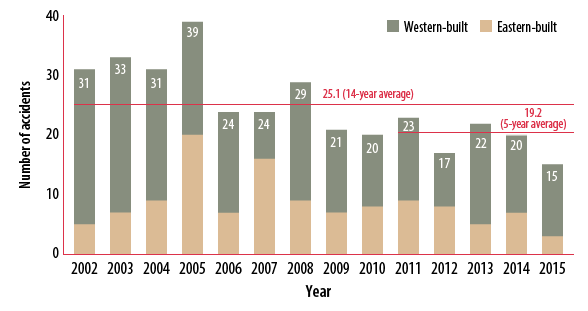
The six fatality-free major accidents in 2015 all involved Western-built commercial jets, and all occurred during the landing phase of flight. For the third year in a row, there were no Eastern-built commercial jet major accidents.
Figure 1 shows the number of all commercial jet major accidents by year since 2002, including the subsets of accidents that involved Eastern-built aircraft.
Figure 1 — Commercial Jet Major Accidents, 2002–2015
Source: Ascend
Figure 2 shows the commercial jet accident rate in accidents per million departures and the rate’s five-year running average, which indicates a continuing declining trend. The accident rate is for Western-built jets only because, even though we know the number of major accidents that involved Eastern-built jets, we do not have reliable exposure data (hours flown or departures) to calculate rates.
Figure 2 — Western-Built Commercial Jet Major Accident Rates, 2002–2015
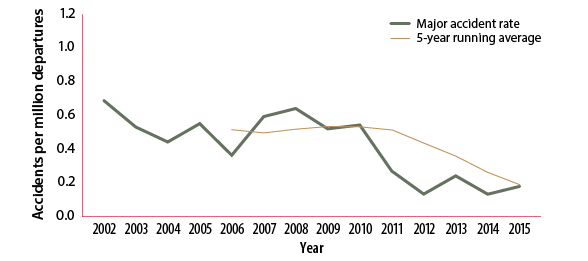
Note: Total departure data are not available for Eastern-built aircraft
Source: Ascend
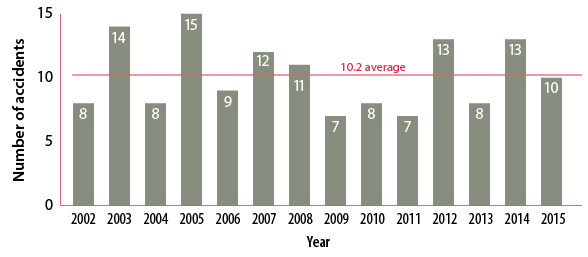
Four of the 10 major accidents involving business jets during 2015 occurred during the approach and landing phases of flight. These accidents represent a decrease of three from 2014. Business jets have averaged 10.4 major accidents per year since 2001 (Figure 3).
Figure 3 — Major Accidents, Business Jets, 2002–2015
Source: Ascend
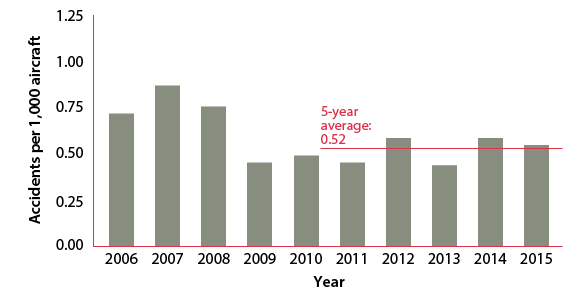
Calculating an accident rate for business jets is difficult because of the lack of preferred exposure data (departures). However, an alternative rate commonly used can be calculated based on the number of business jets in the fleet, and that works out to an annual rate of 0.52 major accidents per 1,000 aircraft for 2015 (Figure 4). The five-year rolling average rate for 2011–2015 was 0.50 per 1,000 aircraft, compared with 0.51 per 1,000 aircraft for the 2010–2014 period.
Figure 4 — Business Jet Major Accident Rates, 2006–2015
Source: Ascend
There were 14 Eastern- and Western-built commercial turboprop accidents involving a total of 15 airplanes in 2015. Of these, two were classified as CFIT — a Trigana Air Service ATR42 crashed on approach to Oksibil, Indonesia, resulting in 54 fatalities, and an Aviastar Mandiri Twin Otter crashed while in cruise flight over Sulawesi, Indonesia, resulting in 10 fatalities.
Half of the major accidents involving commercial turboprops were classified as LOC-I accidents, and one as a runway excursion; four were unclassified. One of the unclassified accidents, as noted, was a midair collision above Vršatec, Slovakia, involving two Let L-410s operated by the same company. The aircraft were carrying parachutists, and although a number of those on board survived, there were seven fatalities, according to preliminary reports.
Commercial turboprops averaged 24.6 major accidents per year from 2002–2015 (Figure 5). This represents a decline over the previously reported 26.1 accidents per year for the 14-year period from 2001–2014. The five-year rolling average has decreased to 19.3 major accidents per year for 2011–2015, compared with the previously reported average of 20.4 accidents per year from 2010–2014.
Figure 5 — Major Accidents, Commercial Turboprops, 2002–2015
Source: Ascend
Although there has been a reduction in the number of accidents recorded for commercial turboprops during 2015, and the sample size is relatively small, LOC-I stands out as the dominant factor worthy of further attention.
For business jets, major accident rates remain relatively low and appear to be trending toward a plateau. However, as with turboprops, LOC-I is the dominant factor in most accidents. Flight Safety Foundation’s Global Safety Information Project (ASW, 12/15-1/16) was established to help identify types of safety data collected within the industry and to find examples of how such information has led to improvements that can be shared to benefit the industry as a whole. The project has revealed opportunities for airlines and other aircraft operators to take advantage of the information already contained within their safety data collection systems to identify further safety enhancements. A number of airlines have already identified such opportunities to enhance the risk resilience of their organizations.
The worldwide commercial airplane fleet at the end of 2015 was about the same size as reported a year earlier and made up of the following:
- Western-built commercial jets comprised of 22,669 (in service) and 1,712 (parked), totalling 24,381;
- Eastern-built commercial jets comprised of 464 (in service) and 340 (parked), totalling 804;
- Western-built commercial turboprops comprised of 4,118 (in service) and 557 (parked), totalling 4,675;
- Eastern-built commercial turboprops comprised of 694 (in service) and 343 (parked), totalling 1,037; and,
- Business jets comprised of 18,922 (in service) and 338 (parked), totalling 19,260. All business jets were Western-built.
During 2015, 3.7 billion passengers were carried on 32 million flights in Western-built jets.
The author is Flight Safety Foundation’s vice president, global programs.
Notes
- Flight Safety Foundation introduced the term major accident in 2006 to describe an accident in which any of the following conditions are met:
- The aircraft is destroyed, meaning that it is not repairable, or if it is repairable, the Ascend Damage Index (ADI) is over 50 percent. The ADI is calculated by dividing the cost of repairs by the cost of the aircraft when it was new.
- There are multiple fatalities to aircraft occupants.
- There is one fatality to an aircraft occupant and the aircraft is substantially damaged.
- This includes aircraft that have a maximum takeoff weight of at least 12,500 lb (5,670 kg) or that have more than 14 seats.
Featured image: © 玄史生 | Wikimedia CC-BY-SA 3.0
