One of the earliest uses of computer simulation to recreate an aircraft accident scenario was more than 30 years ago when Delta Air Lines Flight 191 — a Lockheed L1011 equipped with a second-generation flight data recorder (FDR) — crashed in a microburst.1 The U.S. Justice Department (DOJ) used 40 different parameters from the FDR (acceleration, roll, pitch, heading, etc.), as well as audio from the cockpit voice recorder, ground radar images, weather reports and statements from pilots of other aircraft, to visually replicate the flight’s final moments.
The laser disc video, produced by legal presentation specialists Z-Axis, looks crude by comparison with today’s much more realistic animations. But it was effective. One of DOJ’s lawyers in the case, Roy Krieger, called the animations “pivotal.” The district judge ruled that the U.S. Federal Aviation Administration (FAA) and the National Weather Service were not negligent in the wind shear–induced accident.
With ever-increasing computing power, today’s flight animation tools are used not only by accident investigators but also by hundreds of airlines to regularly analyze flight operations, non-standard incidents, and trends. Flight data animation also is increasingly used for pilot debriefing, training, and airport familiarization, and it is sometimes employed to help airline senior management visualize significant incidents or accidents.
You can view the animation at https://www.youtube.com/watch?v=HY7pH3fzsvY.
What is Flight Data Animation?
Flight data animation is a component of a flight operational quality assurance (FOQA) program, previously known as operational flight data monitoring (OFDM), or simply FDM, or flight data analysis (FDA). FOQA is the proactive use of recorded flight data from routine operations to improve aviation safety. It was defined in a 1993 Flight Safety Foundation report as “a program for obtaining and analyzing data recorded in flight to improve flight crew performance, air carrier training programs and operating procedures, air traffic control procedures, airport maintenance and design, and aircraft operations and design.”2
In 2008, the International Civil Aviation Organization (ICAO) amended Annex 6 to the Chicago Convention to introduce requirements and recommendations related to the implementation of safety management and safety management systems by operators of commercial air transport aircraft and helicopters, including FDM. The FAA defined FOQA in its Advisory Circular 120-82, dated April 12, 2004. The European Aviation Safety Agency requirement is defined in EU-OPS section 1.037.
Among the many flight safety and flight operations efficiency benefits of FOQA are:
- Providing data to help in the prevention of incidents and accidents;
- Providing the means to identify potential risks and to modify pilot training programs;
- Identifying and improving aircraft standard operating procedure issues by reviewing flight data in consultation with the manufacturer;
- Improved fuel consumption; and,
- Reduction in unnecessary maintenance and repairs.
The technologies available for flight data monitoring and analysis programs have improved over the years, and costs have declined. With the added safety benefits of FOQA, more operators are making use of data that are readily available to them.
FDA processes are relatively simple. Data can be taken from an aircraft’s FDR or from a quick access recorder (QAR). This is normally done via a laptop computer, sometimes with special software and a special cable. Some QAR manufacturers also support wireless data transfer. The data file recovered from the aircraft is then processed through specialized software, identifying any predefined events or exceedances. A flight data analyst then reviews the statistical information to identify any unsafe trends. The final step is to make actionable decisions based on that data to improve operations, training and safety.
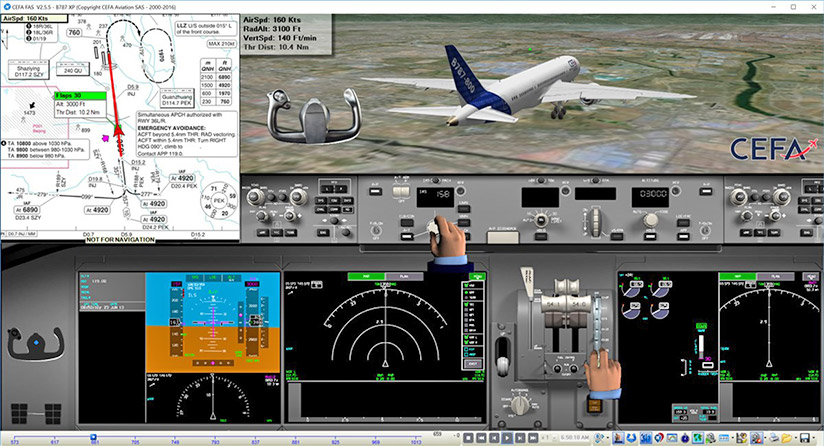
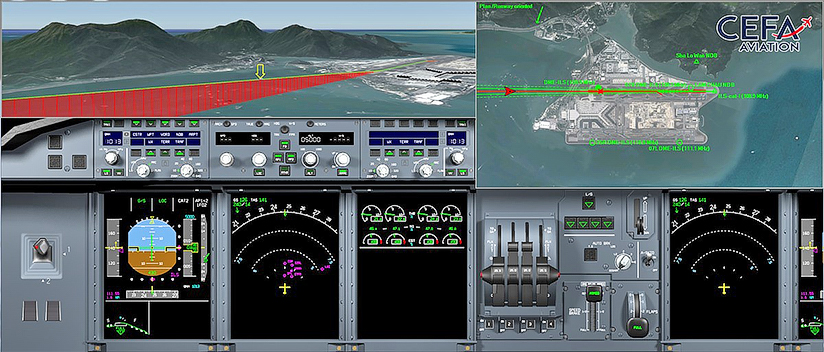
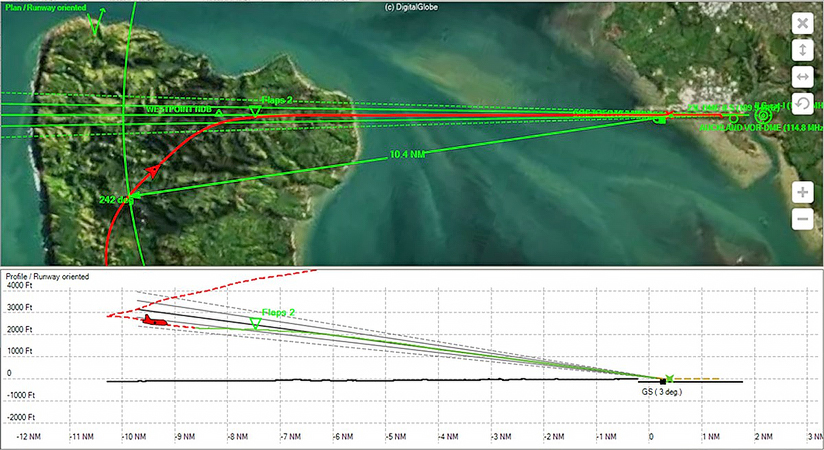
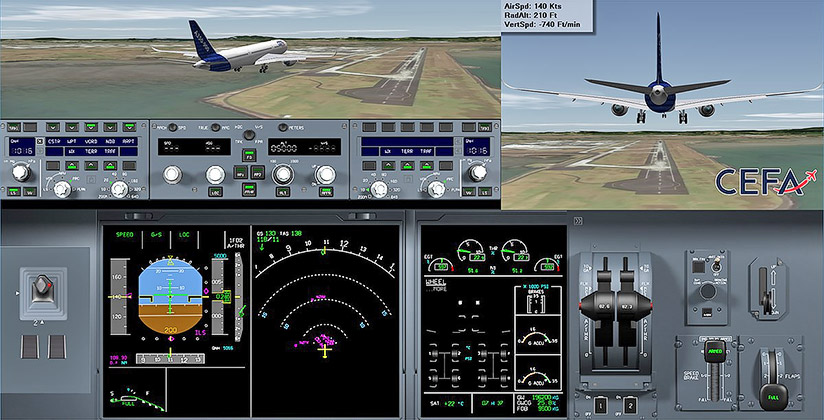
Flight data animation is often a component of FDA. Animations are typically used to visualize an aircraft’s flight profile, cockpit instrumentation, terrain and scenario data. In effect, the FDR or QAR data is used to re-create a portion of the flight, usually the approach and landing or the takeoff, to depict what the pilot may have observed in the cockpit. Graphic representations may include the control stick or yoke, throttles, tachometer, altimeter, horizontal situation indicator (HSI), airspeed indicator, electronic flight instrument system (EFIS), primary flight display (PFD) and electronic centralized aircraft monitor (ECAM).
Some flight data animation systems also depict cultural features such as terrain elevation data, runways, towers, navigation aids, ground vehicles and buildings, as well as environmental factors including visibility, cloud layers and illumination.

Three-dimensional flight animation benefits include:
- Accident and incident investigation;
- Crew self-assessment;
- Flight training;
- Airport familiarization;
- Operational procedures review;
- Airline safety improvement; and,
- Human factors studies.
Flight data animation is an effective means of conveying the results of analyses to various end-users in a manner that is easily understood. The benefits of animation, of course, are contingent on its fidelity and accuracy.
Why Airlines Use Flight Data Animation
In a survey of airlines, researchers from AeroPerspectives, a Europe-based communications consultancy, and Halldale Media, a modelling, simulation, training and publishing company, found that flight data animation tools were most used (by more than half the respondents) for accident/incident investigation. The second most frequent use is flight crew training, followed by management communication.
Survey respondents included flight data management analysts and personnel involved in safety, flight operations, flight crew training and executive/senior management personnel. Respondents worked for international scheduled airlines, regional airlines, charter airlines, FOQA service providers and national aeronautical accident investigation authorities. They represented the Africa, Asia Pacific, European, North American and South American regions.
Airline respondents reported that, when applied to accident/incident investigation, flight data animation provided “more credible investigation” and that “it supports the investigator-in-charge in better identifying the aeronautical accident contributing factors.” One operator said, “It helps the investigators in a better understanding of the human-environmental-machine trinomial relationship.”
A senior flight data analyst for a North American carrier commented: “The flight data animation tool has allowed us to improve our internal investigations by visualizing the data in an entirely different way. It allows us to look at the human factors to understand what the crew was experiencing.”
Another noted a case in which “an investigation of complex avionics problems was made easier by using animation with engineers who do not fly the airplane, but could see what the airplane experienced.”
Another respondent described how a North American operator is applying flight data animation to new destinations, such as Cuba, “where there is no flight data available. We are able to fly the procedures in a simulator, record the animation, and release it to our pilot group via EFB (electronic flight bag). They are able to see the procedures visually before flying their first trip.”
Applying Flight Data Animation
Researchers also spoke at length with individual operators who are currently using flight data animation.
The flight data animation manager for a major European air carrier group said, “Flight data analysis is a more scientific approach than just quality assurance. We are using animation for event review for cases where we see something interesting has happened and we’d like to get a better understanding. The big advantage is that you can recognize a lot more information in a very short time. If you’re just looking at a graph, you often miss something that you didn’t think about. When you see a flight deck animation, you get most of what the pilots would have seen.”
The manager said flight data animation is used by the airline every day and that there are 300 to 400 events per year “where we see something in the flight data that we’d like to better understand.”
He said his department often receives requests from pilots “that they had a special event and they would like to see the data to get a better understanding, to re-live the whole event and talk about open items or CRM (crew resource management) issues.” One example event is a go-around. “In the crew debriefing afterward, there is discussion whether it was necessary and whether it was even a good idea at all. The pilots can exchange their positions and find how they got to different conclusions and resolve that issue between the pilots.”
Flight data animation is also used for training familiarization of airports. “In Eastern Europe and the Med, there are a lot of circling approaches which require a good mental picture,” the manager said. “We do a prepared flight and create an animation video from that.”
The most complex part of creating flight data animations is trajectory. The problem is not with the animation tools but rather the flight data recorders of older technology aircraft such as the Boeing 747-400 or older model Airbus A320s. “They have a small data frame, recording for example a GPS (global positioning satellite) position in a very low resolution,” the manager said. “You have to use quite complex algorithms to cover all the artifacts to compensate for certain errors in the data from an older data frame. We’re still using the most time in animation to get the trajectory right. It’s the all-time number one challenge.
“It’s very different if you have a high-resolution FMC (flight management computer) or GPS position or both, like in a newer aircraft. With newer aircraft, better sensors, better data, it’s much easier.”

A flight data analyst in Africa with a mixed fleet of jets, turboprops and helicopters, said, “We analyze our flights every day. When the aircraft comes back, they transmit the data here to our service. This is decoded by the flight data analysis tool with triggers for certain specific events — let’s say high-speed approach. And when we see certain specific events, we send the data to the flight animation system to give us a better view and a better understanding of what really happened. The 3D is easier to understand than tabular data and graphs. You have the cockpit in front of you; you know what the crew did.”
The airline typically animates one in 10 flights a day, starting from a point about one minute before the aircraft touches down.
“When we see a specific event that we think maybe we should talk to the crew,” he explained, “we call in other colleagues who are pilots and they take a view. … We will call in the crew for their views on what happened, how such a situation could have been prevented, what other procedures they could have used to avoid such an event.”
On a recent flight into Johannesburg, he said, “We had a wind shear warning. It is much better when looking at the animation because you can integrate the cockpit and the weather. You see the wind, how it is changing. You can see the reference to the aircraft.”
“In certain cases, we also make an animation video and send it the pilots involved for their viewing and for other crews to use for training.”
Animations are also shown in the air safety review board attended by the various department heads of the airline. “We showed them an incident we had recently on a particular flight that caused a disruption and delays. We were able to show them what really happened on that day and what was done by the crew to try to avoid the situation.”

The flight data manager for a major Asia Pacific airline said that animations are “quite helpful to the investigators if they are trying to understand the sequence of events. The animation shows the sequence and timing of how things went. It has great value rather than looking at a whole spreadsheet of data; even if you can picture in your head what went on, you have no idea how long that lasted. The animation tool shows you something has changed. … For an unstable approach, for example, fleet managers ask us to animate it from the start to find out where the flight could possibly have started to go wrong, when they decided to abort, or what they could have done to improve the situation. “It’s so much easier to see it from their point of view from the flight deck.”
The airline captures data from about 12,000 flights a month. Of those, perhaps 10 to 15 per month are selected for animation.
A 20-year veteran of flight data analysis, the manager explained that 10 to 15 years ago, “we would spend about four hours to get a decent animation.” Twenty years ago, “there was no animation and a maximum of 12 parameters. We analyzed things manually and typed our reports. Now there’s an unlimited number of parameters.”
The FDM specialist for a South American airline processes flight data from about 800 flights a day and produces about 10 animations daily. “If we find something wrong, an error or a violation, we have a gatekeeper who is responsible to contact the pilots,” the specialist said. “The gatekeeper analyzes all flights that we validated, and they use the flight data animation to check everything they are seeing and provide feedback and debriefings to the pilots.”
Depending on the event, the specialist said, “we send … a print screen of the animation by email to the pilots. They really like the feedback because they can see exactly what happened.”
The airline is conducting a study aimed at reducing the number of events related to energy management. A flight data animation is created for each flight with an energy management-related event “so they can realize what went wrong and why they had that problem,” the specialist added.

The FDM safety officer for a European regional airline said that most animations are by crew request, although high-risk flights and special events are animated for management viewing. “We mainly use the tool for situations on board the aircraft such as a difficult landing,” the safety officer said.
For training, the safety officer added, “we have some special airports rated as CAT B with difficult approaches. To brief the crews in the best way, our training chiefs make several approaches to the airport, and we take the best data and make a video with everything in it, including the charts. It helps a lot.”
Rick Adams, FRAeS, is chief perspectives officer of AeroPerspectives, editor of ICAO Journal and chair of the annual Helicopter Aviation Training Symposium (HATS).
Notes
- U.S. National Transportation Safety Board (NTSB). NTSB/AAR-86/02, Delta Air Lines, Inc., Lockheed L-1011-385-1, N726DA; Dallas/Fort Worth International Airport, Texas; August 2, 1985. The Aug. 2, 1985, crash killed 134 of the 163 people in the airplane and one person on the ground. The NTSB said the probable causes were “the flight crew’s decision to initiate and continue the approach into a cumulonimbus cloud which they observed to contain visible lightning; the lack of specific guidelines, procedures and training for avoiding and escaping from low-altitude wind shear; and the lack of definitive, real-time wind shear hazard information.” The NTSB concluded, “This resulted in the aircraft’s encounter at low altitude with a microburst-induced, severe wind shear from a rapidly developing thunderstorm located on the final approach course.”
- Enders, John H. “Study Urges Application of Flight Operational Quality Assurance Methods in U.S. Air Carrier Operations.” Flight Safety Digest Volume 12 (April 1993): 1–14.
Featured image: Courtesy CEFA Aviation

